Table of Contents
What are Callbacks?
Certain Windows APIs support passing a function pointer as one of its parameters. This parameter is then called when a particular event is triggered, or a scenario takes place. Either way, this is usually user-controlled and can be abused from an offensive perspective by passing a malicious function or shellcode. Some of the popularly known callbacks are EnumChildWindows, RegisterClass, etc.
There has been much research on the topic of callbacks where they have been abused to be used as call stack evasion, sleep timers, evasion from memory scanners, DLL loading and execution, etc. In this blog post, we try to uncover previously unknown callbacks that could be abused maliciously and produce a tool for the same. In this research, we aim to show how various static analysis methods can be used to create and automate the discovery of previously unknown scenarios and details, and we hope to see more similar contributions in the future.
Overview
There are two main types of branching in most assembly languages,
- Direct calls: The compiler is aware of the destination address during compile time. These are easy to predict for the CPUs and easier to perform optimizations on.
- Indirect calls: Here the destination address or the callee is not known at compile time. The branching happens dynamically. Usually this is performed using registers, pre-reserved memory spaces, etc.
Windows APIs that support callback opportunities usually take in a function pointer address (or a structure, as you will see) as one of its function arguments. The prototype of the function usually is of the format below:
void someWindowsAPI(int arg1, int arg2, void *func_ptr);To find a potential function that allows the user to send in a callback function pointer, it needs to satisfy two conditions,
func_ptrshould be controlled by the user.func_ptrshould be invoked as an indirect call somewhere within the parent Windows API function.
As mentioned above, indirect calls are usually compiled to call reg, where reg is any of the registers. But since this research is focused on scanning through multiple windows DLLs, we need to accommodate Control Flow Guard or CFG.
Control Flow Guard
CFG, in a very simple sense, is a protection mechanism that is placed during compile time within Windows executables to prevent malicious indirect calls that could be abused using ROPs and other memory corruption bugs. Most if not all of the DLLs compiled that we will be scanning are compiled with Control Flow Guard, meaning any function pointers passed through a potential function will not result in a call reg signature.
As shown in the following picture, when CFG is enabled, the callee is passed via the RAX register to another wrapper function called __guard_xfg_dispatch_icall_fptr. This function takes in the RAX register to perform the call further.
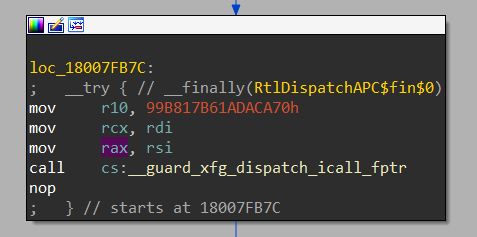
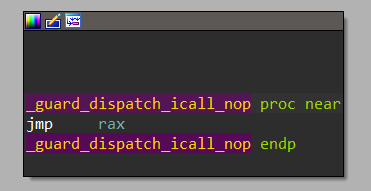
The function __guard_xfg_dispatch_icall_fptr is just a wrapper for a bunch of other sub-functions, which eventually boils down to _guard_dispatch_icall_nop. This function is the final wrapper around the instruction jmp rax where the control flow is redirected toward the user-controlled function pointer.
So our plan to scan for potential target Windows APIs that support a callback opportunity is as follows,
- Scan the function code to check if a CFG dispatch call exists.
- Retrieve the immediate source of the
RAXregister. - Identify the first-ever source and verify if it is one of the function arguments.
Note: Some functions have certain checks and verifications that will need to be passed in order to have code reachability towards the CFG dispatch. While executing those potential target functions, the user might need to pass in other parameters or sometimes initialize structures.
Prepping Miasm
To implement my scanning idea, I chose to go with the Miasm framework because it contains a lot of necessary features that I needed to overengineer the solution. There are several alternatives that could be used that perhaps would be faster or offer a more efficient solution, but coming from a CTF background, Miasm seemed to be the simplest and most appropriate choice to pick, although the concepts described could very well be applicable to other tools.
Miasm is a reverse engineering framework that supports symbolic execution and contains its own lifter and IR. It supports Use-Def graphs, in-built disassembler, PE loader, and emulator amongst other stuff. Each of these features will be necessary down the line. Before we proceed to scan every function, we need to initialize a bunch of things with Miasm that will need to be queried moving forward.
First, we start by reading the file and passing it to the PE container, which is defined by ContainerPE class. The file data that was read can be passed to the function Container.from_string(data, loc_key) whose return value will be the ContainerPE class.
        if self.__read_file(self.filename) == False:
            return False

        self.pe_container: ContainerPE = Container.from_string(self.data, LocationDB())
Since we are going to scan an entire directory, we need to check if the files we are scanning are DLLs (some executables also have exported functions, but that is for a future update). We check if the file that we read is a DLL by parsing the Characteristics parameter from it’s COFF Header. If the Characteristics parameter contains the IMAGE_FILE_DLL flag, then we can be mostly sure that we are dealing with a DLL. We then proceed to extract all the functions in the export table of the DLL.
Miasm uses an object called LocationDB() that, simply speaking, is an object that keeps track of the symbol names and the corresponding offsets of those symbols within the binary. This is sort of like a separate database populated whenever a new symbol for an offset is defined in the binary. Since the Import Address Table (IAT) contains symbols that will be required for us to check against, we need to populate the loc_db by adding their details and corresponding offset within the binary. This can be performed by parsing the IAT and retrieving both the offset and the symbol using Miasm’s in-built functions.
        for ((dll, symbol), addresses) in pe.get_import_address_pe(self.pe_container.executable).items():
            for va in addresses:
                self.loc_db.add_location(offset=va, name=f'{dll}!{symbol}', strict=False)
Once all the previously mentioned objects and details are initialized, we can proceed to the core part of the hunt to find the potential target functions.
Hunting for Indirect Function Calls
In some DLLs, we notice that exported APIs behave as a proxy call to some other DLL; these functions are usually not in the .text section. Attempting to disassemble these exported API obviously will create an exception since there is no actual code block to be disassembled and the exported API is merely a proxy call. Hence, to avoid the tool from crashing in between, we need to add a check that identifies if the address of the exported API that we are scanning is within the .text section and contains the section flag 0x60000020. This can be implemented as follows:
pe_file.getsectionbyvad(func_addr).flags != SEC_TEXT_FLAG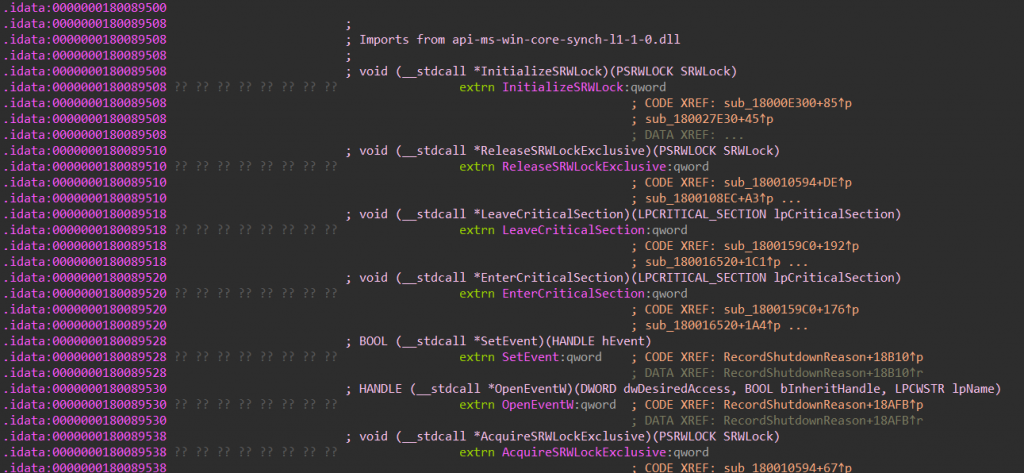
We then initialize the disassembly engine of Miasm and retrieve the Control Flow Graph of the function using the functions below:
mdis = dis_x86_64(self.pe_container.bin_stream, loc_db=self.loc_db)
self.asmcfg: AsmCFG = mdis.dis_multiblock(func_addr)
Once the graph is produced, we go through every block of the function and iterate it to check if any of the instruction present within the block contains the call opcode. We then parse the destination of the call instruction to find the callee. Since we need to accommodate the CFG dispatch signature, we parse the callee to check if the destination is a memory address, which in this case, is supposed to be the address of __guard_xfg_dispatch_icall_fptr.
if inst.name.lower() == "call":
    if inst.name.lower() == "call":
        tokens = str(inst.args[0].ptr).split("+")
We then proceed to check if the destination is of the form [RIP + some_offset], which usually is identified as a call to another function within the provided binary. We then calculate the actual address by adding the offset, the instruction length, and the current address to retrieve the final destination address.
if len(tokens) == 2 and "RIP" in tokens[0]:
    call_addr = inst.offset + int(tokens[1], 16) + inst.l
These addresses can point to multiple locations that might not be the guard call dispatch. To avoid that, we need to exclude those addresses by checking them against our previously populated loc_db. This database is populated with the IAT and all the imported functions that are called will also be excluded. This can be checked to see if the address is not contained within the didat section, which is mostly reserved for imported functions.
if (self.loc_db.get_offset_location(call_addr) == None) and 'didat' not in section_name:
    return (inst, block.lines[0].offset)
Hunting for Potential Callback Opportunities
Once we have identified a potential target function that contains the CFG dispatch call, the next step is to trace back the RAX register to find its initial source. This source needs to be user-controlled. And if that succeeds, we will have a potential callback opportunity in hand.
To start tracing back the initial source, we need to first find where the RAX is defined just before the dispatch and retrieve its immediate source register or memory address. And this instruction could very well be of many forms:
mov rax, regmov rax, [rax]mov rax, [reg + offset]- and more
We also need to make sure that there are no alterations to the value within RAX after its definition up until the CFG dispatch call. If any modification takes place between those two events, then our callback function is not guaranteed to be called. Hence, for the first version, we stick to two scenarios that would most likely guarantee no modification in between.
1. RAX register is in the same block as the CFG dispatch call and the definition of the RAX register is no later after the dispatch call.

2. RAX register is defined in the predecessor block that is immediately preceding the current block where the dispatch is present.
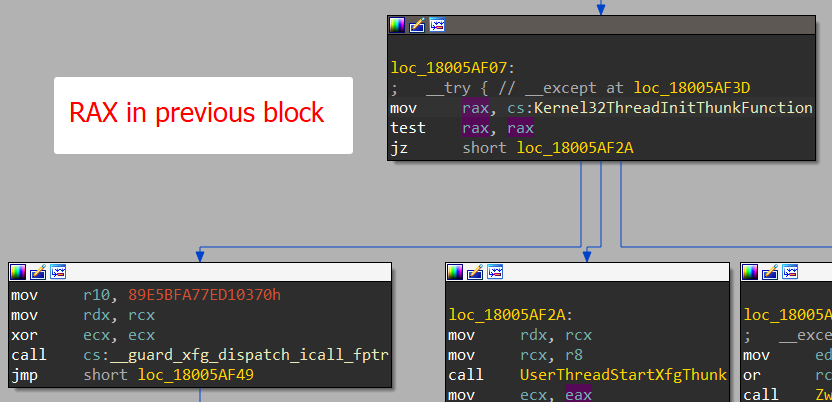
Although there are other cases where the definition of RAX register could exist elsewhere before the dispatch, we are sticking to the simplest case here and further updates could support more cases.
Once we get the address of the instruction where the definition takes place, we can proceed to find the source register and continue the analysis further. This is where miasm’s IR assists us, since Asm graph is harder to parse than the IR graph, we will use the IRCFG class provided by the framework to search through the graph and also have consistency in parsing the definitions and the subsequent usage of the registers. We can do this by initializing the lifter and converting the AsmCFG to IRCFG as shown in the code below:
lifter = Machine(self.pe_container.arch).lifter_model_call(self.loc_db)
self.ircfg: IRCFG = lifter.new_ircfg_from_asmcfg(self.asmcfg)
To retrieve the immediate predecessor of the current block, we can use the function ircfg.predecessors(). This function iterates through every node within the graph and stores the nodes that have either the c_to (default branch) or c_next (conditioned branch) pointing to our current node (the CFG dispatch node). We yield this result and store it in a list to search through later.
        prev_nodes = []
        for node in self.ircfg.predecessors(self.ircfg.get_block(block_start_addr).loc_key):
            prev_nodes.append(node)
Once we have the list of predecessor nodes, we can parse through these nodes to find if any of the instructions contain the RAX definition as we discussed earlier. But before that, we have the problem of finding the initial source of where the current definition was trickled down to. There are many ways to find that out, such as Taint Analysis, Symbolic Execution, etc. These methods could assist in finding if a particular function parameter has code reachability near the CFG dispatch call. But after a couple of days of trial and error, I decided to stick with the Data Flow analysis method Miasm provides called the Use-Def graph.
Use-Def Graph
Use-Definition Graph, or in short Use-Def graph, is a data structure that contains the definition of a particular variable and the uses of that variable across the function and its entire control flow. This is usually used for compiler optimizations. The inverse of this graph is called Def-Use graph, which will help us find the necessary information regarding our relevant registers.
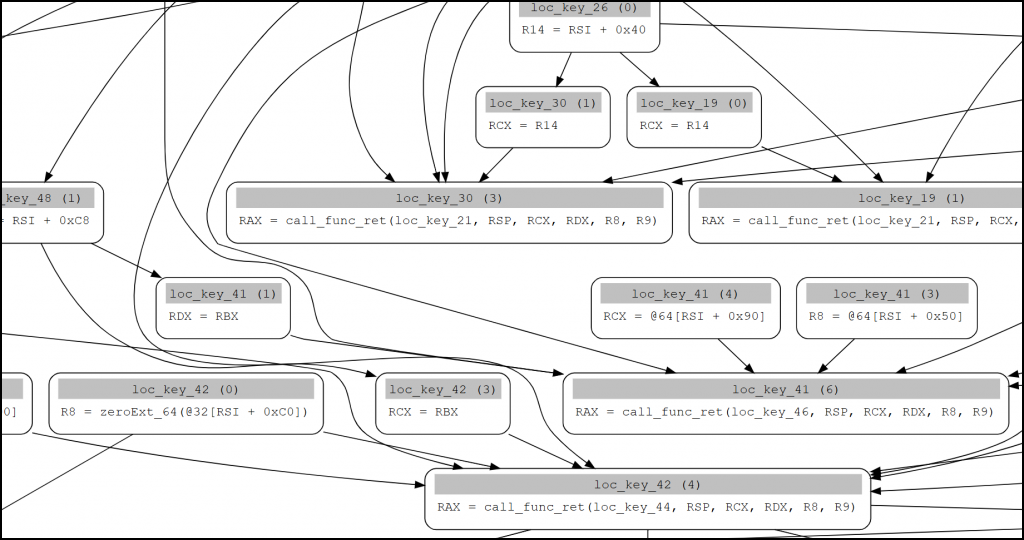
With this graph, I’m able to track the immediate source of the RAX register until its initial source. This allows me to track and find whether the function pointer, if any, passed through any of the function arguments and will be reachable until the CFG dispatch.
To start initializing the Def-Use graph, we do the following:
        reachings = ReachingDefinitions(self.ircfg)
        self.defuse_cfg: DiGraphDefUse = DiGraphDefUse(reachings)
Previously, we retrieved the predecessor blocks allowing us to check if any of them contained the RAX register immediately before the CFG dispatch. Now, we proceed to use those blocks to check their respective reachable parents.
Reachable parents are all the predecessor blocks that could potentially reach the current block through either of the conditional jump branches. Retrieving these reachable parents allows us to access the first ever block where the definition of the source is initially defined.
In most cases, iterating through and getting the final value of the reachable parents list should land us with the first ever definition of that source. This hopefully is in the first block of the function indicating that one of the function arguments is used. This can be implemented as follows:
        for cur_leaf in potential_leafs:
                all_reachable_parents = self.__defuse_reachable_parents(cur_leaf)
                leaf = all_reachable_parents[-1]
                source = self.__get_block(leaf).values()[0]
                source = self.__get_reg(source)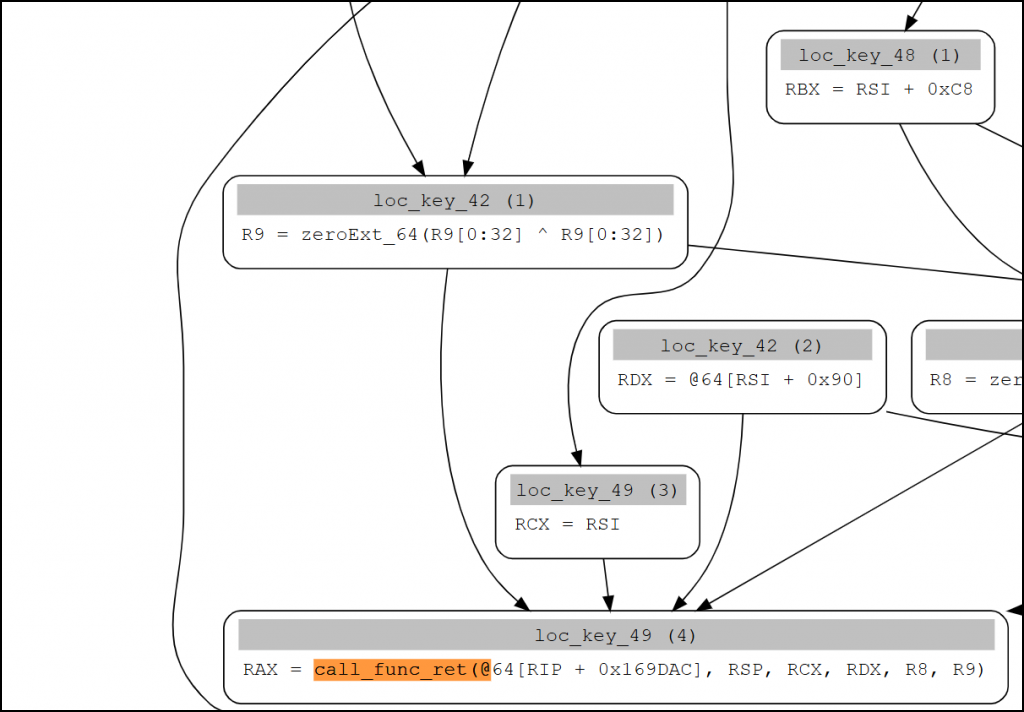
As always, since most cases do not hold everywhere, we need to manage scenarios where certain parent nodes end up in the middle of the Control Flow Graph. This requires us to parse and find the register responsible and check if those registers have any other sources that we were unable to uncover directly. This is mostly due to memory references, structures, etc., which usually do not hold the simple signature opcode dst_reg, src_reg. Although this is going to be a far from perfect solution than I had liked, this is the current one implemented until further overhaul.
We define a recursive function that proceeds to find the final possible definition of the source regardless of directly finding it via the graph, or indirectly finding it due to structure-related memory references. This could also mean there are false positives even though we tried our best to keep the constraints as small as possible.
This function takes in two parameters. One is the source value, usually the register for which we need to find the initial definition without modification in between. The second is the instruction and the corresponding block details of the source we passed as the first parameter. The conditions that we need to satisfy in order to exit the recursion are as follows:
- Return True if the source that was passed to the function is the first ever definition of it by identifying that that the corresponding block has no predecessor nodes, indicating that it is likely the first ever block in the function (where usually function arguments are defined).
- The source is one of the function arguments by checking if it is either of the first four registers (RCX, RDX, R8, R9).
Until the function is satisfied, the function will traverse every Def-Use leaves and nodes. Since we do not want to jump into infinite recursion, we avoid branches that have the source as the same variable in its block and the iterating node is the same as the node we are currently checking against. Additionally, we also avoid definitions that could be from the pop instruction.
        for cur_leaf in self.defuse_cfg.leaves():
            if cur_leaf.var == source and cur_leaf != arg_instr_node and \
            (self.__is_child_block(arg_instr_node, cur_leaf, self.ircfg) != True and self.__is_pop_instr(cur_leaf) != True):
                reachable_parents[cur_leaf] = self.__defuse_reachable_parents(cur_leaf)
We store the possible reachable parents for the rest of the leaves. In case none of the leaves produce any result, we also try and find within the entire list of nodes. Since the definitions can also come after the CFG dispatch or the current node you are trying to check against, we need to avoid them as well. This can be done by checking if the node we are checking against and the iterating node that we need to retrieve to find the source register from is not one of the reachable sons of our current node. If it is, it most likely indicates that the definition is below the current node we are trying to check against.
        if start_leaf.label == end_leaf.label:
            if start_leaf.index < end_leaf.index:
                return True

            return False

        for leaf in graph.reachable_sons(start_leaf.label):
            if leaf == end_leaf.label:
                return True
In some scenarios where the definitions of the register is the only definition within the entire function code, we are returned a solo node that has no predecessors and successors. This can be checked by invoking the predecessor and successor functions of the IRCFG.
return True if (self.ircfg.successors(leaf.label)) == 0 and len(self.ircfg.predecessors(leaf.label)) == 0 else False
Additionally, we want to skip the scenarios as previously mentioned, which are either at the last block of the function, or a pop instruction. In Miasm, the pop instruction is treated as a definition within its IR. This can be checked as follows:
        if isinstance(source, ExprMem) and "RSP + " in str(source.ptr):
            return True

        elif isinstance(source, ExprOp) and "RSP + " in str(source):
            return True

        elif isinstance(source, AssignblkNode):
            source = self.__get_block(source).values()[0]
            return self.__is_pop_instr(source)

        return False
This function will keep checking for sources until we are sure that it is either of the function arguments or does not satisfy any of the conditions and skips through the edge cases.
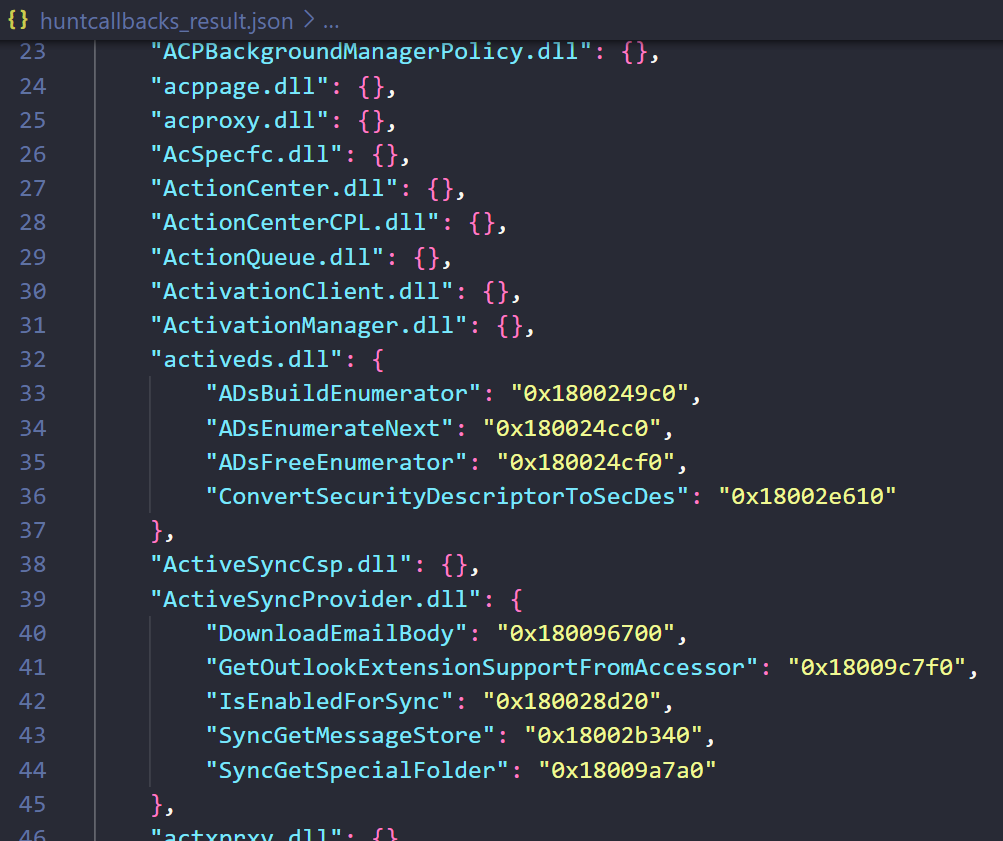
Once the function returns successfully, we might have a potential callback supporting Windows API that is user controllable. We store these outputs as a JSON file and also display it with a cool table that is dynamically rendered using the Rich Python Framework.
Improvements
The tool could be extended to support a lot more cases and scenarios, and perhaps also automatically generate the PoC for invoking the callback using symbolic execution to solve the conditional jumps. Some improvements that could be done in the future are the following:
- Add support for more cases where the
RAXregister is not just at the predecessor nodes. - Improve the output by adding in if certain functions require conditional branching or not.
- Add support for symbolic execution to solve the conditions to print PoC.
- Allow support for complex structures that are not only in the format of
[reg + offset]. - Have a more efficient method to traverse and find the initial source of definition.
Demo and Results
In the following recorded gif, we can see the tool working through the system32 directory scanning all possible DLLs within.

The resulting JSON file will contain all potential target functions identified as well.
Conclusion
This research and the subsequent development of the tool was a result of applying binary analysis techniques across offensive security. The results that the tool produced hopefully assists in making better defensive and offensive techniques. The concept of the tool and the ways to utilize the graph theorems could further be expanded to include solutions to even more problem statements; therefore, we encourage you to try your own hand at various problem statements that could be easily solved using the concepts above.
Link to tool: <to be released soon>


