

This blog covers Windows pool memory from scratch, including memory types, debugging in WinDbg, and analyzing pool tags. We’ll also use a custom tool to enumerate pool tags effortlessly and explore the segment heap. This is the first post in our VR (Vulnerability Research) & XD (Exploit Development) series, laying the foundation for heap overflows, pool spraying, and advanced kernel exploitation.
What is the Windows Kernel Pool?
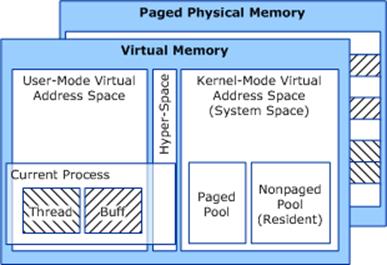
The Windows Kernel Pool is a memory region used by the Windows kernel and drivers to store system-critical structures. In short, the Kernel Pool is the kernel-land version of the user-mode “heap”.
Unlike user-mode memory, the kernel pool is shared across all processes, meaning any corruption in the kernel pool can crash the entire system (BSOD).
- Kernel memory allocations are categorized into Paged Pool and Non-Paged Pool.
- These pools are global resources, meaning they are accessible system-wide by all kernel-mode components. Since multiple drivers and system components share these memory pools, improper handling can lead to security vulnerabilities, memory corruption, or system instability.
Pool Internals
Essentially, chunks that are allocated and placed into use or kept free are housed on either a page that is pageable or a page that is non-pageable.
It may be interesting to know that two types of page exist. One is paged pool and the other is non-paged pool:
- Non-Paged Pool: Always in RAM, never swapped to disk. Used for critical system components and drivers.
- Paged Pool: Can be moved between RAM and disk when necessary. Used for less time-sensitive data.
To sum up, in order to take advantage of a heap corruption vulnerability, such as a use-after-free (UAF), a researcher will make a distinction as to whether it is a UAF on the non-paged pool, or a UAF on the paged pool. This is important because the paged pool and non-paged pool are different heaps, meaning they are separate locations in memory.
In simpler terms, in order to replace the freed chunk, one must trigger the use-after-free event. This means that there are different object structures that can be placed on the non-paged pool or, respectively, the paged pool.
Setting Up Kernel Debugging
To get started with kernel debugging, you need to set up a Windows VM and configure it using the following admin commands. Typically, this setup requires two machines: a debuggee system that is our target Windows machine and a debugger system that we will be issuing debug commands from. For basic debugging, you can use local kernel debugging (lkd) on a single system. If you haven’t installed it yet, you can download the Windows Debugging Tools from Microsoft’s official website.
bcdedit /debug on
bcdedit /set TESTSIGNING ON
bcdedit /dbgsettings net hostip:192.168.29.119 port:54444 key:1.2.3.4
bcdedit /dbgsettings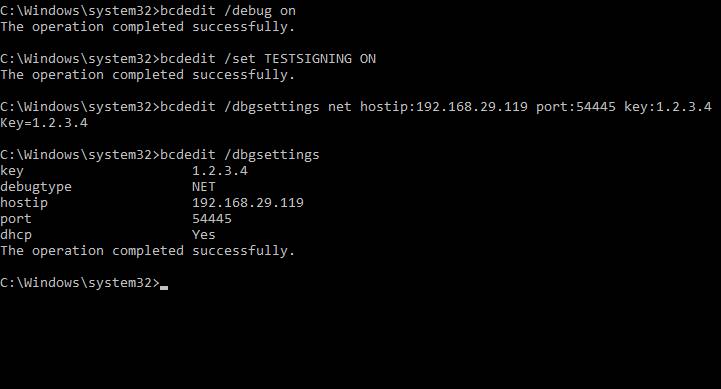
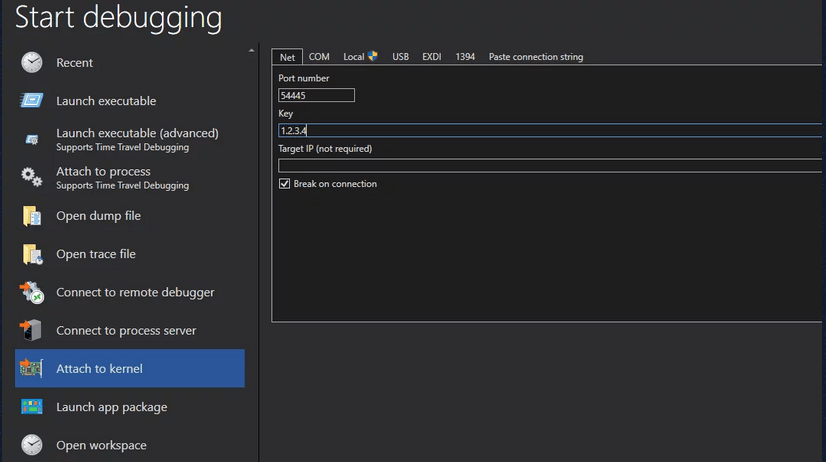
Now, on your base machine, start WinDbg and try to enter the port number and key. After that, restart the virtual machine.
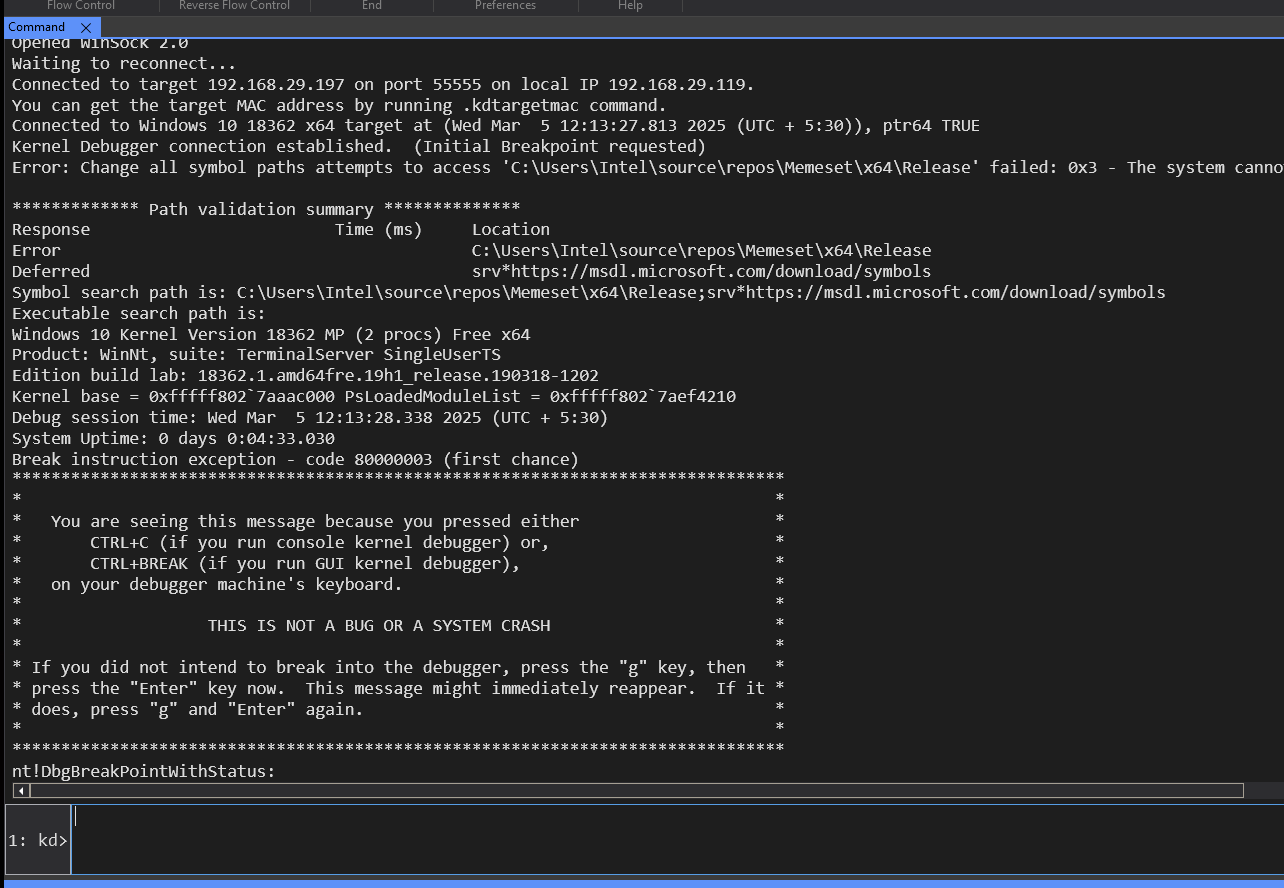
The following screenshot shows kernel debugging on the virtual machine.
First, if we want to see basic view pool memory in kernel debugging, we can use the !vm 1 command in WinDbg. This provides a detailed summary of system memory usage, including information about paged pool and non-paged pool allocations.
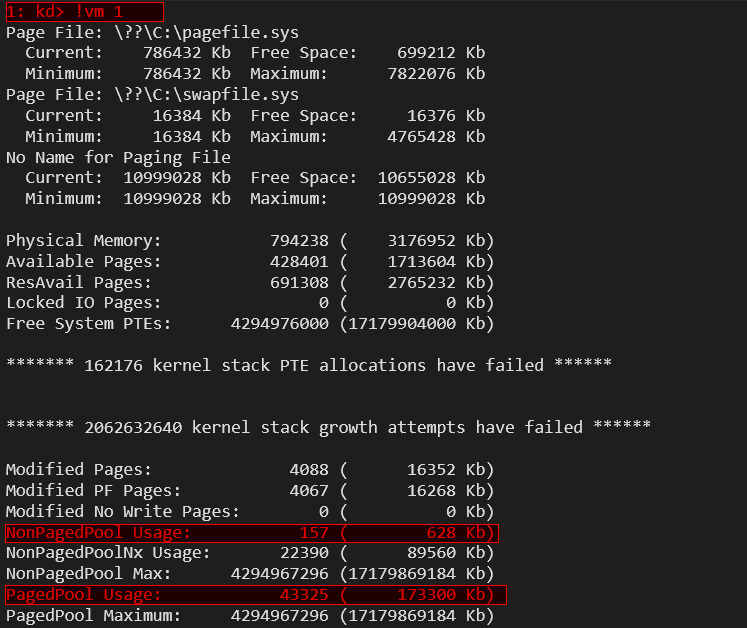
Here, 157 KB represents the current available memory in the system, while 628 KB shows the total committed memory, meaning memory that has been allocated and is in use. This helps in analyzing memory consumption and potential allocation issues in kernel debugging.
If you want to explore further, you can use The !vm 2 command in WinDbg. This provides a more detailed breakdown of memory usage across different pool types and memory zones compared to !vm 1.
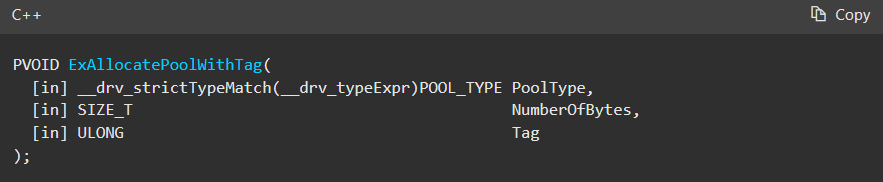
First, Windows provides the API ExAllocatePoolWithTag, which is the primary API used for pool allocations in kernel mode. Drivers use this to allocate dynamic memory, similar to how malloc works in user mode. Note: While ExAllocatePoolWithTag has been deprecated in favor of ExAllocatePool2, it is still widely used in existing drivers so we will examine this function.
Later, I will show in detail how to develop a kernel driver by using this API for ExAllocatePoolWithTag.
Here’s a short explanation of the key parameters used in Windows pool memory allocation:
- PoolType → Specifies memory type (e.g., PagedPool for pageable memory, NonPagedPool for always-in-RAM memory).
- NumberOfBytes → Defines the size (in bytes) of the memory allocation.
- Tag → A 4-character identifier used for debugging and tracking memory usage.
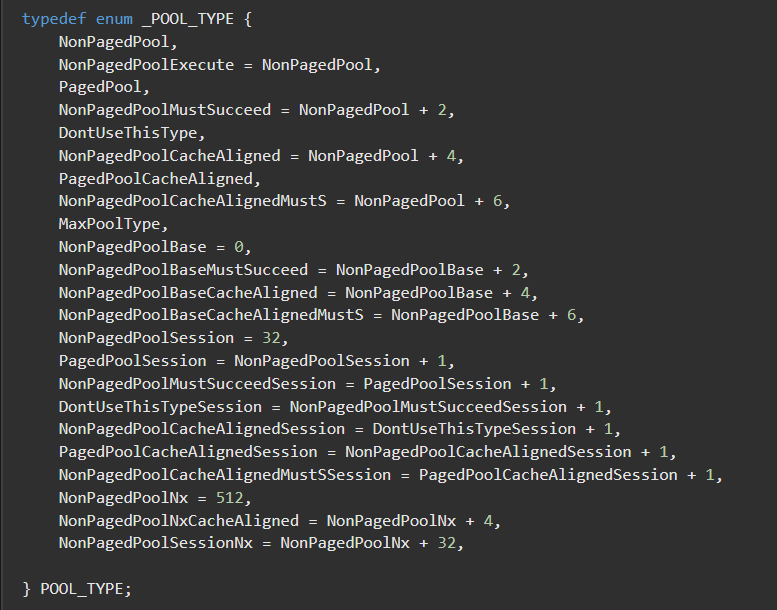
There’s more than one kind of _POOL_TYPE. If you want to explore more, you can check out Microsoft’s documentation. We are only focusing on paged pool, non-paged pool, and pool tag.
It is also worth mentioning that every chunk of memory on a pool has a dedicated pool header structure inline in front of the allocation, which we will examine shortly in WinDbg.
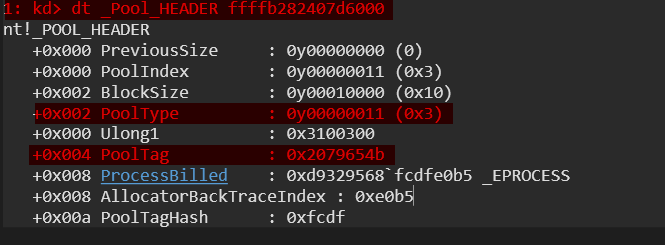
Now let’s use the !pool <address> command in WinDbg to analyze a specific memory address. We want to display details about a pool allocation, including its PoolType, PoolTag, BlockSize, and owning process/module.
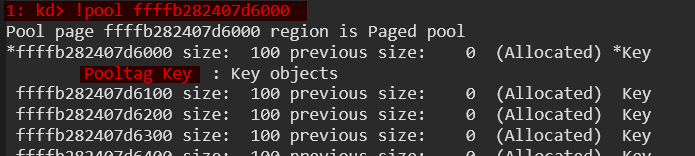
As we can see in the screenshot above, the memory allocation is categorized as paged pool. The details also tell us that the page is ‘Allocated’ or free, and we can discover the pool tag and sometimes the details will also give the binary name, driver name, and other information. Feel free to explore.
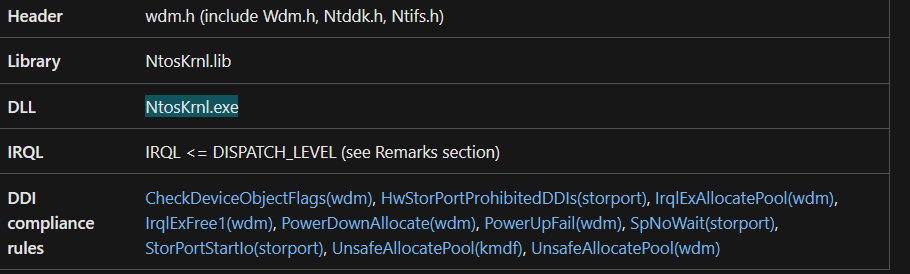
So, the question arises—how do we find the address of a pool allocation? It’s actually quite simple! If we check the documentation, we can see that ExAllocatePoolWithTag is a function provided by NtosKrnl.exe (the Windows kernel).
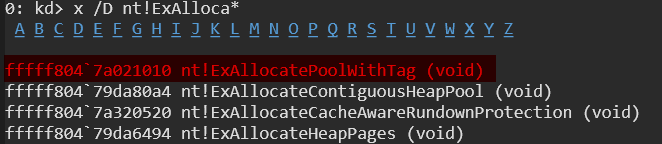
This means we can set breakpoints in WinDbg to track memory allocations in real-time. So first let’s examine the API with a command called x /D nt!ExAlloca* in debugger and then set a breakpoint.
Let’s set a breakpoint at that specific address and see if it gets triggered. As shown below, we’re using the bp <address> command.

As soon as we resume our debugger with the g (Go) command, it will automatically hit the breakpoint and we can view the information gathered from register.
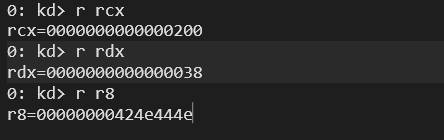
In WinDbg, when analyzing a call to ExAllocatePoolWithTag, you can check the registers to understand the allocation request:
- RCX = 0x200 → Pool type (e.g., NonPagedPoolNX). Compare with PoolType from above.
- RDX = 0x38 → Number of bytes requested for allocation.
- R8 = 0x424E444E (‘NDNB’) → Pool tag used to identify the allocation source.
By monitoring these values, you can determine how drivers allocate memory and track specific pool tags in the kernel.
We will demonstrate another register rax, but first try to Step Out and use gu.
Now, let’s use !pool <address>.
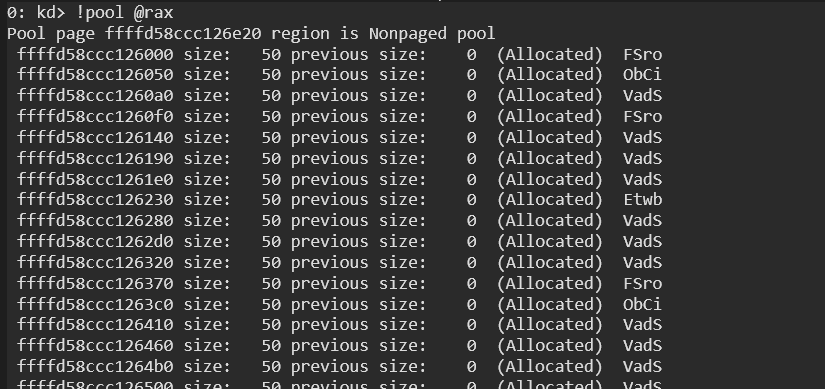
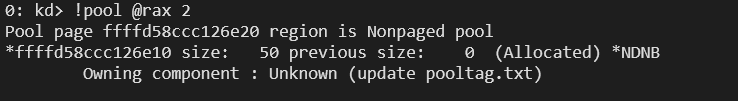
But isn’t this strange? We were looking for the tag NDNB. Here’s a handy tip: to find more interesting data, use the command !pool @rax 2.
What is a Pool Tag?
A Pool Tag is a four-character identifier that helps track memory allocations in Windows kernel pools (PagedPool, NonPagedPool, etc.). Every time memory is allocated using APIs like ExAllocatePoolWithTag, a pool tag is assigned to identify the allocation’s origin. This is useful for debugging memory leaks, analysing kernel memory usage, and tracking driver allocations.
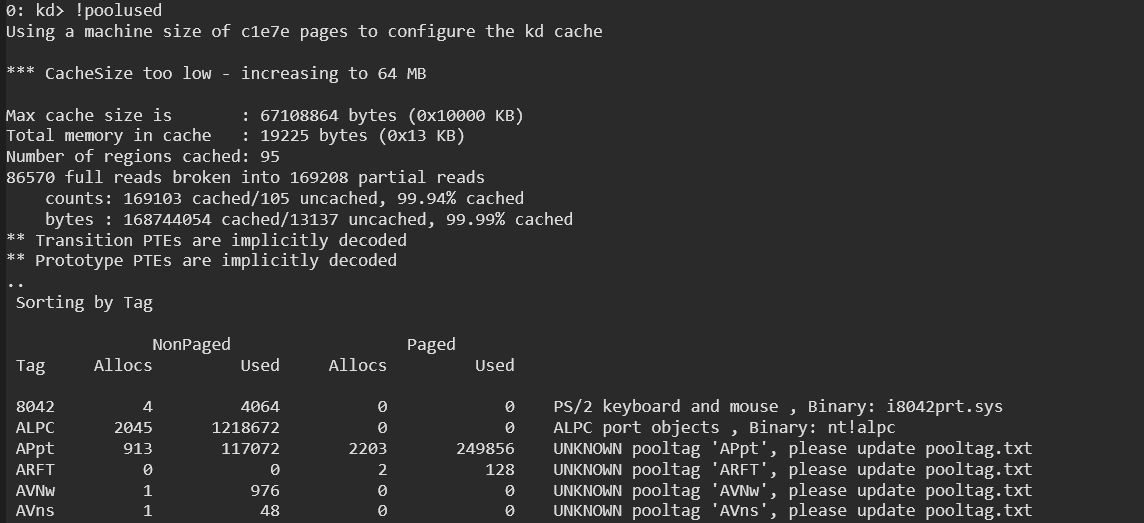
How does one Explore Pool Tags in WinDbg? By viewing pool allocations with !poolused.
To see all active pool tags and their usage statistics, give it a try:
Exploring Pool Tags by Creating a Custom Kernel Driver
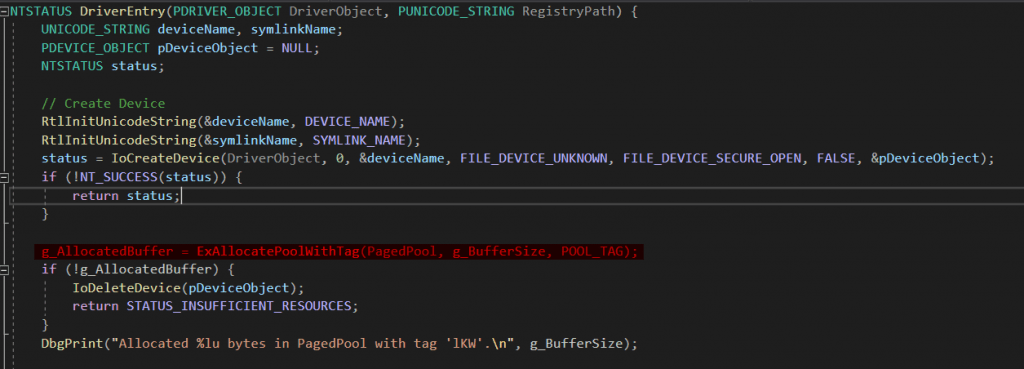
We know that pool tags come from the ExAllocatePoolWithTag API, which is responsible for allocating memory in kernel mode. But how can we observe this in action? The best way to truly understand how pool tags work is to create our own kernel driver, allocate memory with a custom pool tag, and then analyze it using WinDbg.
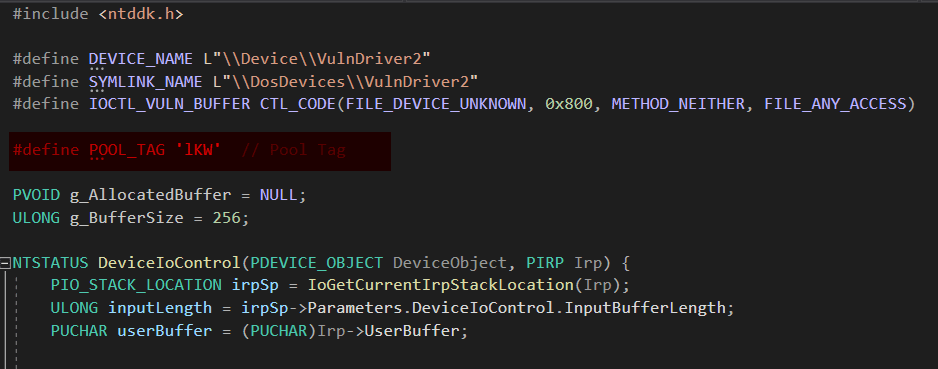
As shown, we’ve used ExAllocatePoolWithTag in our custom driver to allocate memory with a specific tag.
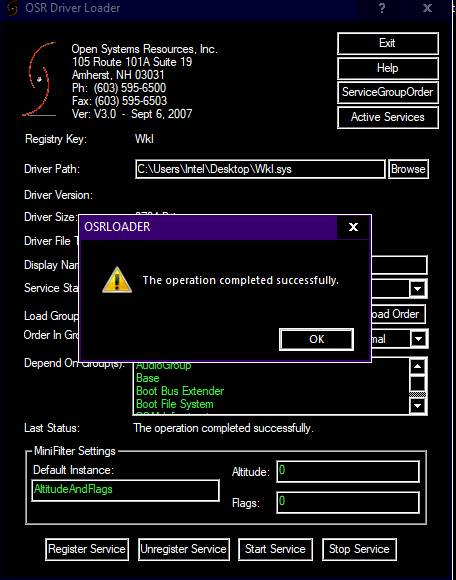
Before we can inspect the tag, we first need to load the driver into the system.
I prefer using OSR Driver Loader because it’s simple and easy to use. However, you can also load the driver manually using the sc (service control) command:
- sc create MyDriver type= kernel binPath= C:\Path\To\MyDriver.sys
- sc start MyDriver
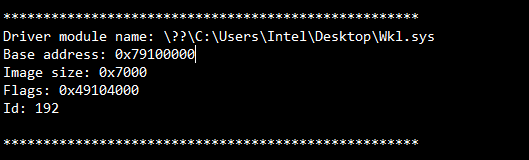
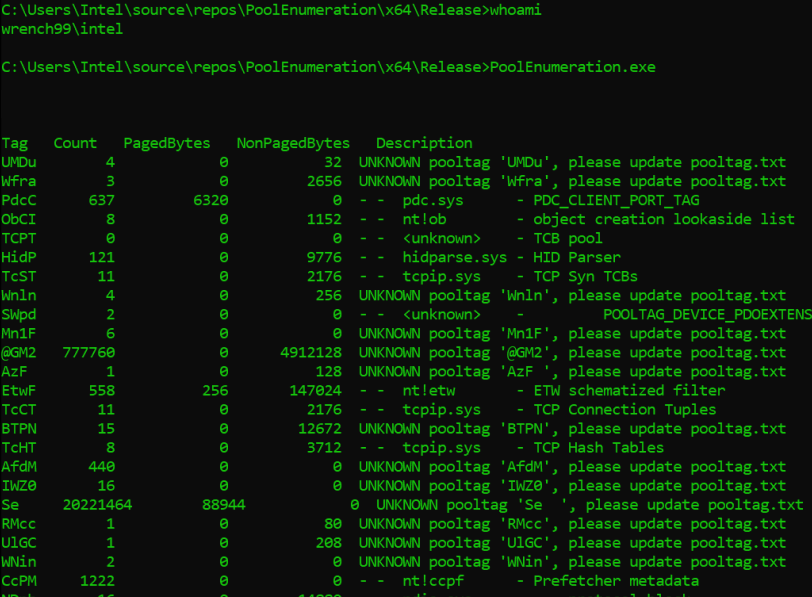
You don’t need to manually check if the driver is running or properly registered. I’ve created a tool that will handle everything for you. Simply run the tool, and it will generate an output showing your driver along with other enumerated details.
On Windows 10, you can run this tool without admin privileges in some cases. However, after certain security patches, you may need to run it as an administrator. I’ll provide the tool in the references for easy access.
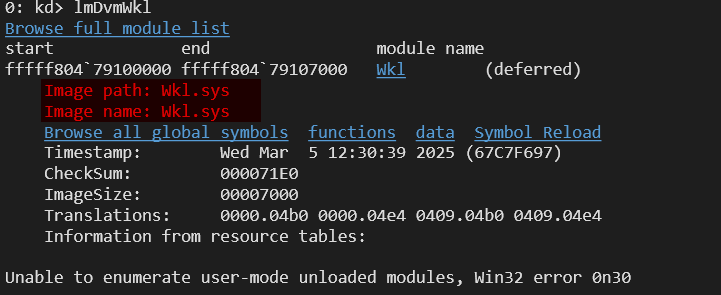
To check if our driver (Wkl.sys) is loaded in WinDbg, we can use the command lm Dvm Wkl.
After running the command in WinDbg, we can now filter and display only the memory allocations related to our driver. Here’s how we did it: !poolused 2.
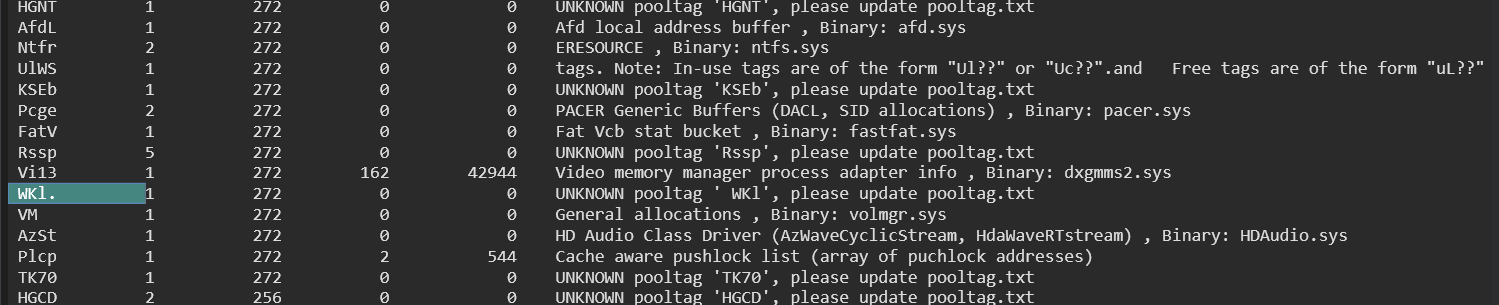
This will search the PagedPool allocations (2) and only display results where the pool tag starts with WKL. The period (.) acts as a wildcard for any additional characters after WKL.
Reverse Engineering the Kernel Drivers
In the real world, we rarely have access to a kernel driver’s source code. Instead, we rely on reverse engineering techniques to analyze how the driver allocates memory, what pool tag it uses, and how it interacts with the system.
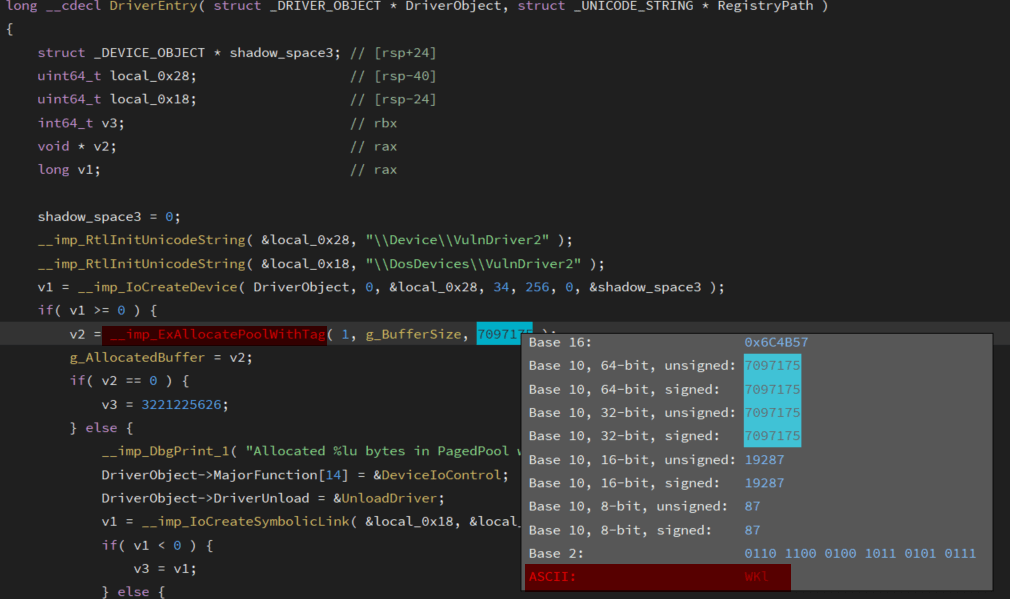
We successfully identified the pool tag, which appears as “WKL” in ASCII. However, we also noticed an additional value, 1, alongside the tag. This represents the paged pool in memory allocation. When analyzing a driver through reverse engineering, the pool type is often denoted numerically—where 1 corresponds to the paged pool and 0 represents the non-paged pool. This helps us understand how the driver is managing its memory allocations.
Explaining the Tool: Windows Pool Tag Scanner
Typically, analyzing pool tags requires either developing a kernel driver or reverse engineering existing drivers, which can be a lengthy and complex process. However, I have built a tool that doesn’t require admin privileges on Windows 11 (though on some patched versions, admin rights may be needed). This tool allows users to enumerate pool tags without needing deep kernel access, making debugging and research more accessible.
Code Breakdown
This tool leverages NtQuerySystemInformation to retrieve pool tag usage information from Windows without requiring admin privileges. Let’s break it down step by step.
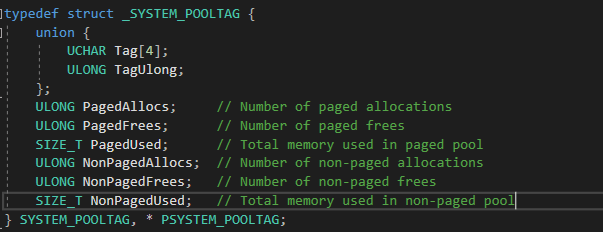
- This structure holds memory allocation statistics for different pool tags.
- PagedAllocs & PagedUsed represents paged pool memory allocations.
- NonPagedAllocs & NonPagedUsed represents non-paged pool memory allocations.
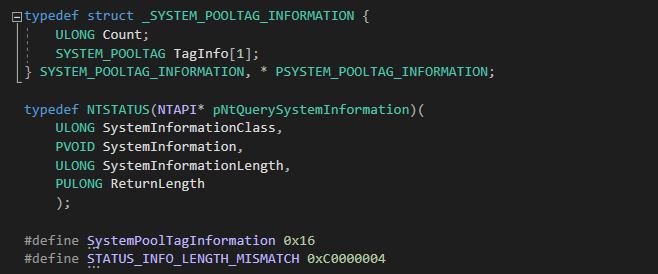
- This structure _SYSTEM_POOLTAG_INFORMATION holds all pool tag details, with a Count field to indicate the number of tags.
- NtQuerySystemInformation is a native Windows API used to query system information.
- SystemPoolTagInformation (0x16) is the specific class that retrieves pool tag memory usage statistics.
- STATUS_INFO_LENGTH_MISMATCH indicates that we need to allocate a larger buffer for storing results.
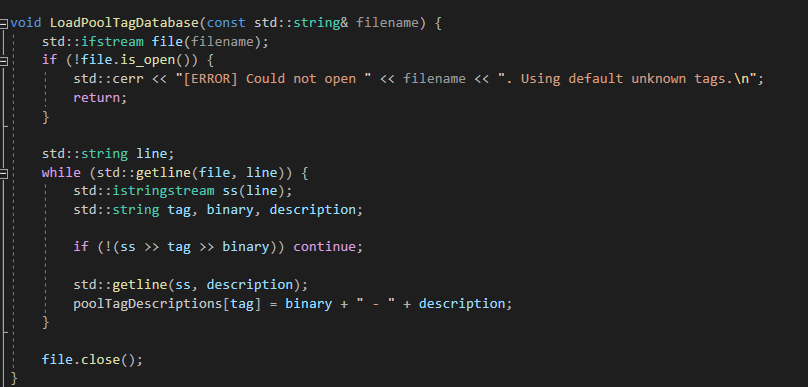
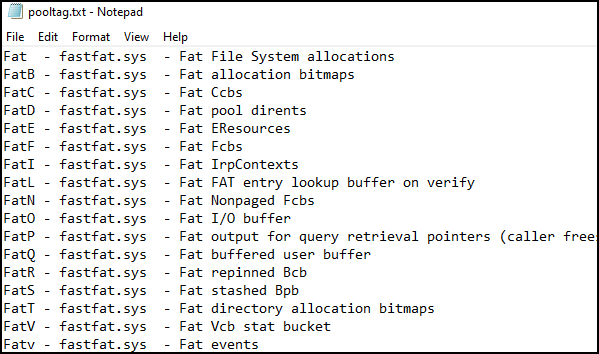
- The function name LoadPoolTagDatabase loads descriptions for known pool tags from a file called pooltag.txt. (keep updated).
- If a tag isn’t in the file, it is marked as “UNKNOWN”.
- This allows us to map pool tags to their respective drivers/functions.
Why This Tool is Useful?
- No Admin Required – Works on Windows 11 without admin privileges (except on newer security patches).
- Real-Time Pool Tag Analysis – Quickly enumerates pool tags, showing allocations.
- Custom Pool Tag Database – Can be updated with new descriptions for better understanding.
- Simplifies Debugging – Instead of manually reversing drivers, this tool helps track down allocations easily.
Bonus Segment Heap
Let’s talk about the segment heap—something that was originally designed for user mode but was later introduced into the Windows kernel with the 19H1 build of Windows 10.
What’s the deal with the segment heap?
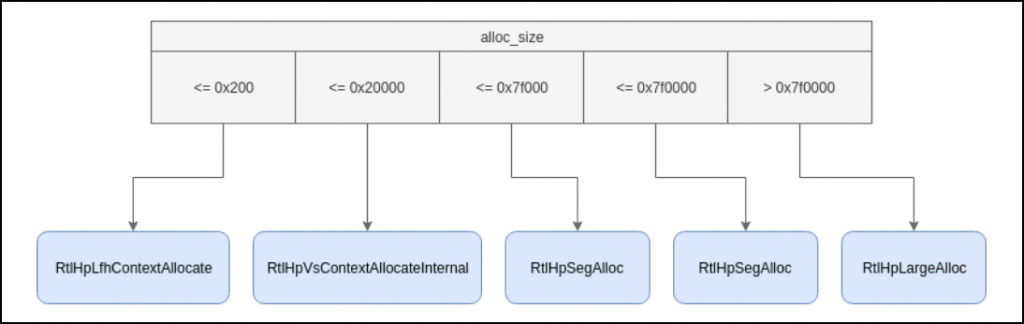
Whenever a component in the kernel requests dynamic memory using APIs like ExAllocatePoolWithTag, the request doesn’t just go to a single type of memory pool anymore. Instead, Windows now has four different ways to handle the allocation:
- Low Fragmentation Heap (kLFH) – Optimized for reducing memory fragmentation (RtlHpLfhContextAllocate).
- Variable Size (VS) – Handles allocations of varying sizes efficiently (RtlHpVsContextAllocateInternal).
- Segment Alloc – Allocates memory in segments to improve performance (RtlHpSegAlloc).
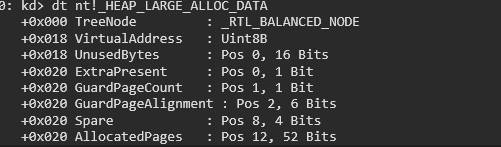
- Large Alloc – Handles large allocations separately (RtlHpLargeAlloc).
The figure shown below demonstrates how the requested allocation size maps to the selected backend.
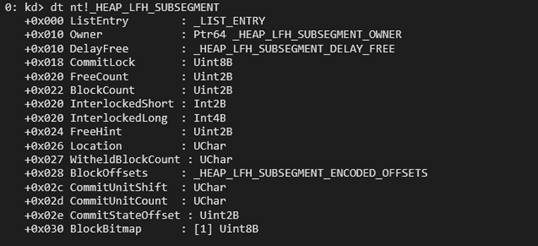
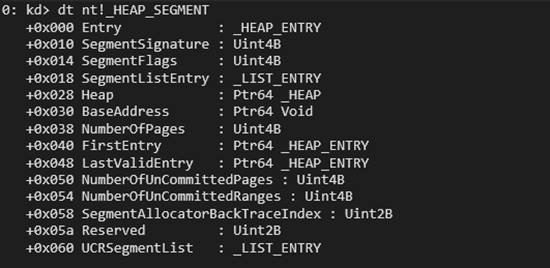
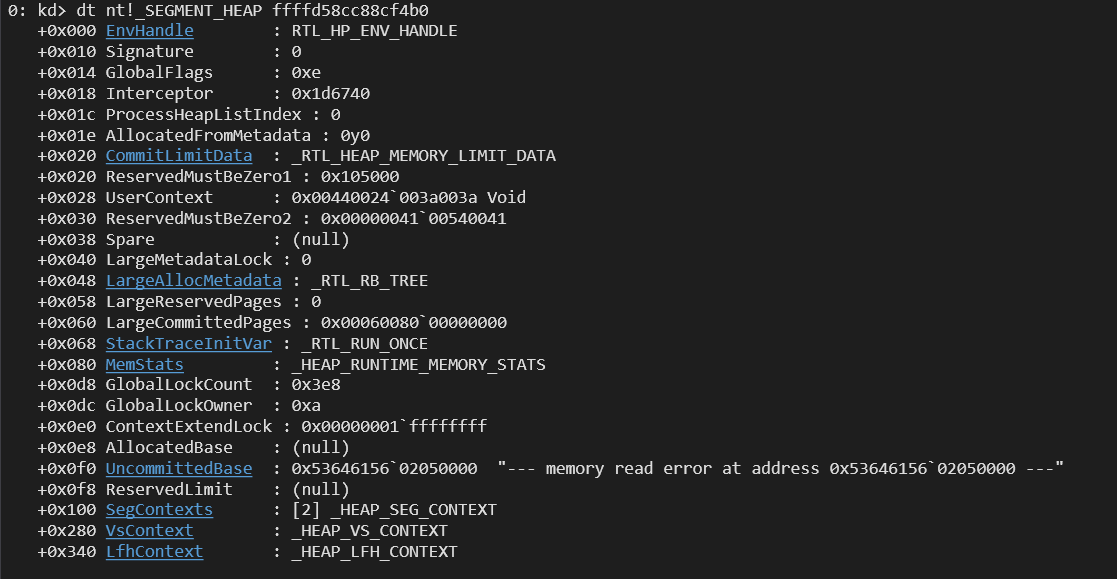
All of these are managed by the _SEGMENT_HEAP structure, which keeps track of different memory segments, manages metadata, and ensures memory is used efficiently. In Windows Debugger, we can use this command: dt nt!_SEGMENT_HEAP ffffd58cc88cf4b0.
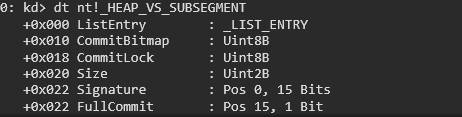
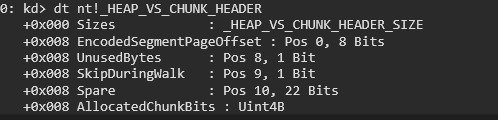
There are two types of headers when dealing with heap structures. The first is the one we previously examined, which includes general heap metadata. The second is HEAP_VS_CHUNK_HEADER, a structure specifically used when chunks are allocated using the VS (Variable Size) segment.
Conclusion
In this deep dive, we explored the Windows Kernel Pool and how to analyze it effectively using WinDbg. We examined the APIs involved in memory allocation and how custom drivers allocate memory within the kernel. Additionally, we investigated pool tags, learning how to identify our custom kernel driver’s pool tag in WinDbg.
To make things easier, we also introduced a custom tool that can enumerate pool tags without requiring administrative privileges, offering a convenient way to analyze kernel memory usage. Furthermore, we delved into reverse engineering techniques to understand how pool tags are structured within kernel drivers.
Finally, we explored the Segment Heap, breaking down its different types—Low Fragmentation Heap (LFH), Variable Size (VS), Segment Alloc, and Large Alloc—while learning how to inspect them in WinDbg. This knowledge provides a solid foundation for understanding kernel memory internals and analyzing heap behavior at a granular level.
Links for the Tools:
- Pool Enumeration – https://github.com/WrenchRtlzer0memory/PoolEnumeration
- Driver Enumeration – https://github.com/WrenchRtlzer0memory/DriveEnumeration