

Instruction trace is one of the most powerful but underutilized technologies for reverse engineering and malware analysis. In this article, I review the capabilities of WinDbg’s Time Travel Debugging (TTD) feature, and compare it against Intel Processor Trace (Intel PT). Both are excellent tools for cybersecurity research.
WinDbg is of course the “de facto” standard for debugging the Windows kernel and user applications. And debugging is the flip side of the coin of reverse engineering; to really succeed in this craft, one must be proficient in both. With an estimated 1.6 billion devices running Windows globally, and the OS being such a huge attack surface, a deep understanding of Windows internals is crucial to many cybersecurity engineers.
But this deep understanding takes a lot of time and hard work. The Windows codebase is huge; and the learning curve is steep. Just reading the Windows Internals books is not enough; it’s important to get hands-on experience, and to work on specific projects, to burn the needed knowledge into your brain. And this is where the use of tools becomes essential.
Reverse engineering unfamiliar code is hard. A fixed view of the decompiled code (static analysis) provides one level of insight; but seeing the code in operation (dynamic analysis) takes it to another level. This latter methodology often involves the use of trace features that can reconstruct code flow at the source/symbolic and assembly language level. Among tools/technologies that provide these capabilities are Intel PT and TTD.
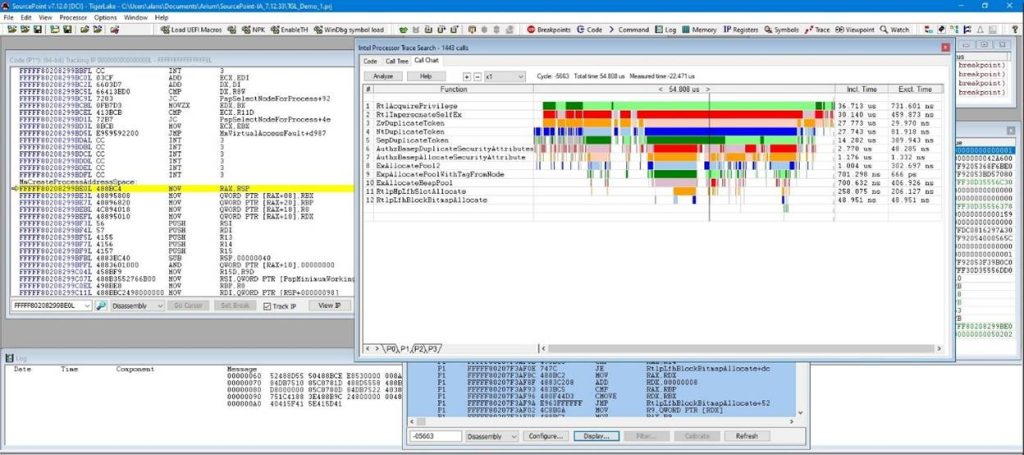
Intel PT is a near-real-time instruction execution trace capability built into Intel CPUs. It captures all instructions executed into an extremely compact data structure placed into system memory on a target. With the SourcePoint JTAG-based debugger, after a target is halted, the trace is extracted and decoded for presentation to the user. This is raw CPU instruction trace; all executed instructions are captured, with virtually no real-time impact, since everything is happening at the silicon level. Here’s a sample:
FFFFF8037EAA9434 483B2B       cmp         rbp,[rbx]
FFFFF8037EAA9437 726A         jc          ::ntkrnlmp.KeQueryCurrentStackInformationEx+1b3
FFFFF8037EAA94A3 B001         mov         al,01
FFFFF8037EAA94A5 EBA2         jmp         ::ntkrnlmp.KeQueryCurrentStackInformationEx+159
FFFFF8037EAA9449 488B5C2440   mov         rbx,[rsp+40]
FFFFF8037EAA944E 488B6C2448   mov         rbp,[rsp+48]
FFFFF8037EAA9453 488B742450   mov         rsi,[rsp+50]
FFFFF8037EAA9458 4883C420     add         rsp,00000020
FFFFF8037EAA945C 415F         pop         r15
FFFFF8037EAA945E 415E         pop         r14
FFFFF8037EAA9460 5F           pop         rdi
FFFFF8037EAA9461 C3           retn
FFFFF8037EAA9CF8 84C0         test        al,al
FFFFF8037EAA9CFA 741A         je          ::ntkrnlmp.KeCheckStackAndTargetAddress+56
FFFFF8037EAA9CFC 483B5C2440   cmp         rbx,[rsp+40]
I’ve written extensively about Intel PT on ASSET InterTech’s website; Intel PT is a capability built into ASSET’s SourcePoint debugger. Below are a couple of good background reading resources:
WinDbg with Intel Processor Trace
Using ChatGPT on Windows Secure Kernel with Intel Processor Trace
And the ultimate technical reference for Intel PT is the Intel Software Developers Manual (SDM).
Below is an image of decoded and visualized Intel PT within SourcePoint in action:
Above and beyond just being used for debugging UEFI, hypervisors, and kernels, Intel PT is starting to be used within the EDR industry to identify rogue code. Prelude Security recently published the article Introducing Runtime Memory Protection, a research preview of a user-mode Windows agent that detects malicious code execution. For those interested in more detail, the full paper is here: Closing the Execution Gap: Hardware-Backed Telemetry for Detecting Out-Of-Context Execution. Interestingly, this application only uses a tiny fraction of the functionality of Intel PT: it focuses solely on indirect branch targets, with no use of Taken/Not Taken (TNT) packets, which in turn precludes the use of disassembly, one of Intel PT’s most powerful features.
On the other hand, TTD is a form of trace like Intel PT, but it differs significantly in its operation and scope. It operates more like a “time machine”: you can go forwards AND backwards in the trace, and look at the values of registers, memory and the call stack; you can see all the state of the process as you go through its timeline. Intel PT cannot do that; you start at a predetermined location of the code, and capture all instructions leading up to a break. And Intel PT doesn’t capture state (you can easily capture some state such as registers, as referred to in the article Using LLMs to analyze Hyper-V Register State and Instruction Trace, but it doesn’t capture all state, such as memory and call stack). TTD works by injecting a DLL into a target process that provides an emulation layer to track state.
Although it appears to be very well maintained by Microsoft, and it’s built into the WinDbg debugger, there doesn’t seem to be a lot of current documentation on it, and it isn’t referred to all that often in the cybersecurity publications I read. To illustrate its power, I’ll walk us through a typical introductory use case.
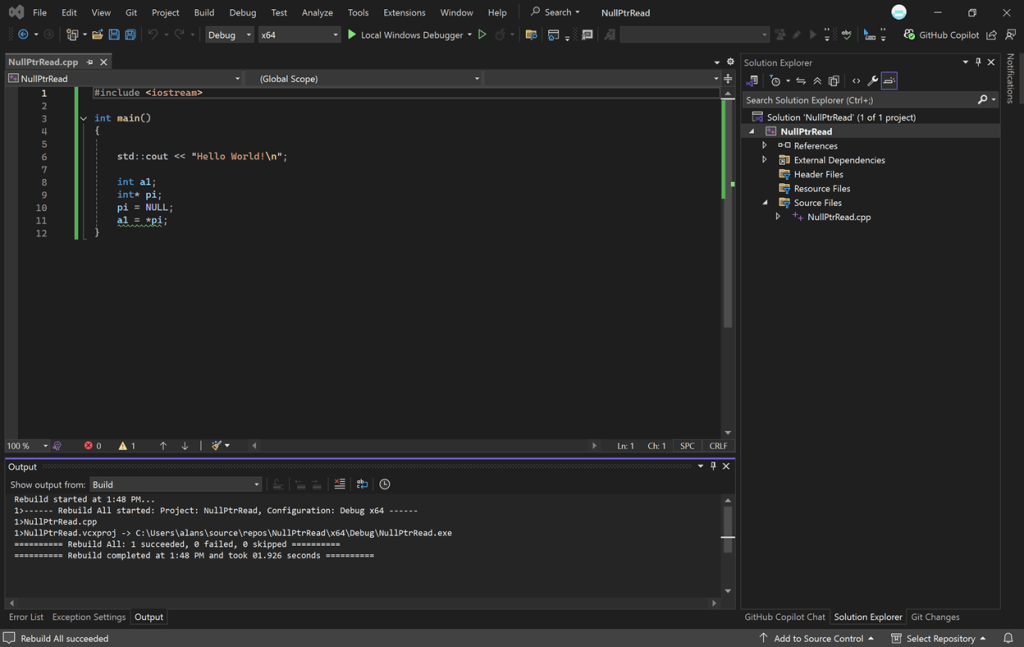
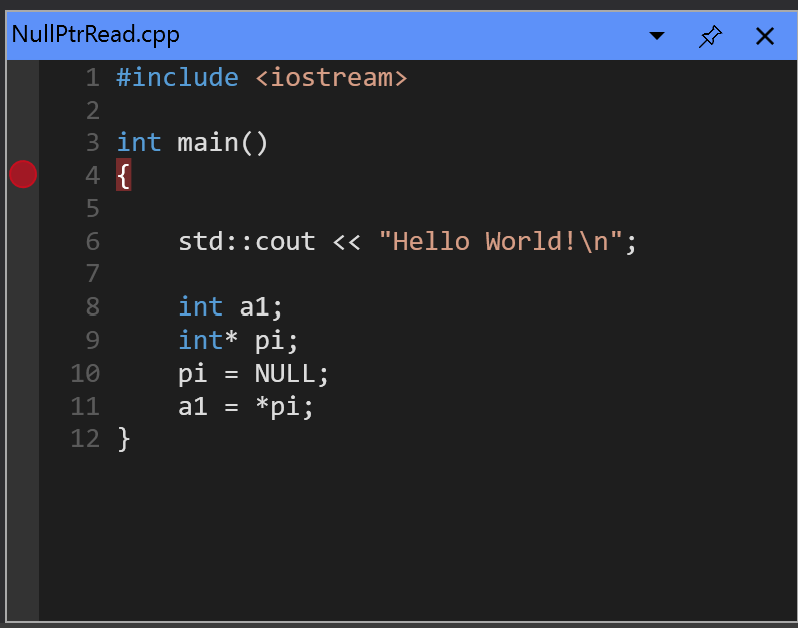
I created a small simple example console application that performs a null pointer dereference that will be the subject of this explanation. Here’s the code, NullPtrRead.cpp, in text form and as seen in Visual Studio:
#include <iostream>

int main()

{

    std::cout << "Hello World!\n";

    int a1;

    int* pi;

    pi = NULL;

    a1 = *pi;

}
The variable pi is a pointer to an integer, and you can see that it is set to NULL, where NULL is a constant that evaluates to a value that is guaranteed not to be equal to any valid memory address. Then in the last line:
a1 = *p1
we are dereferencing pi, meaning we are trying to access the value at the memory address stored in pi. This is a bug since pi is NULL, and the program will try to read from a memory address that it is not allowed to access. Windows’ memory protection mechanism detects this illegal access and terminates the program, resulting in an exception fault.
In essence, the code is trying to fetch a value from a non-existent location, which is an illegal operation. This is a common programming error that can lead to crashes and security vulnerabilities.
To see this in action and how TTD can debug it, first just do a Build on this code and run it from within Visual Studio. I’m using VS2022, Community edition. Create it as a standard Windows console application. You should see the following when you run it:
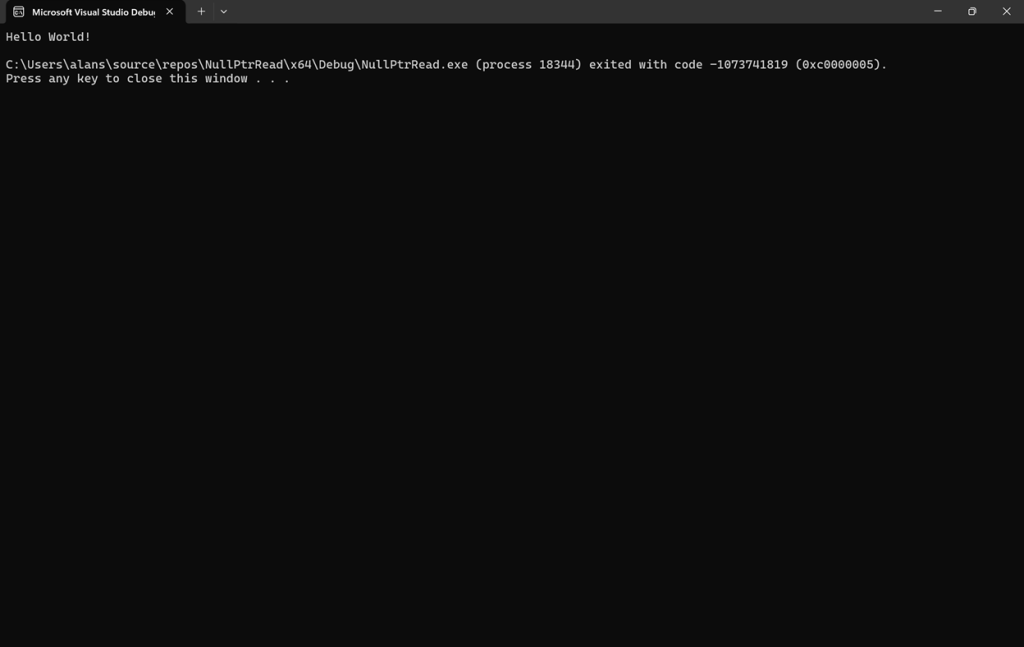
And this is the displayed text within the window:
Hello World!

C:\Users\alans\source\repos\NullPtrRead\x64\Debug\NullPtrRead.exe (process 18364) exited with code -1073741819 (0xc0000005).

Press any key to close this window . . .
NTSTATUS 0xc0000005 (STATUS_ACCESS_VIOLATION) is an access violation, as expected.
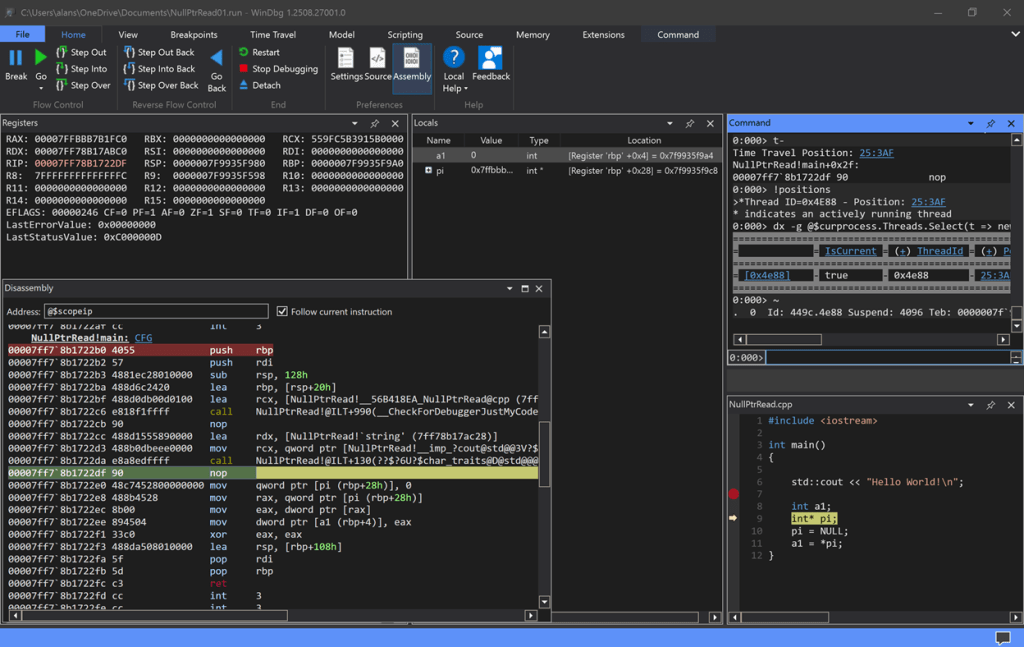
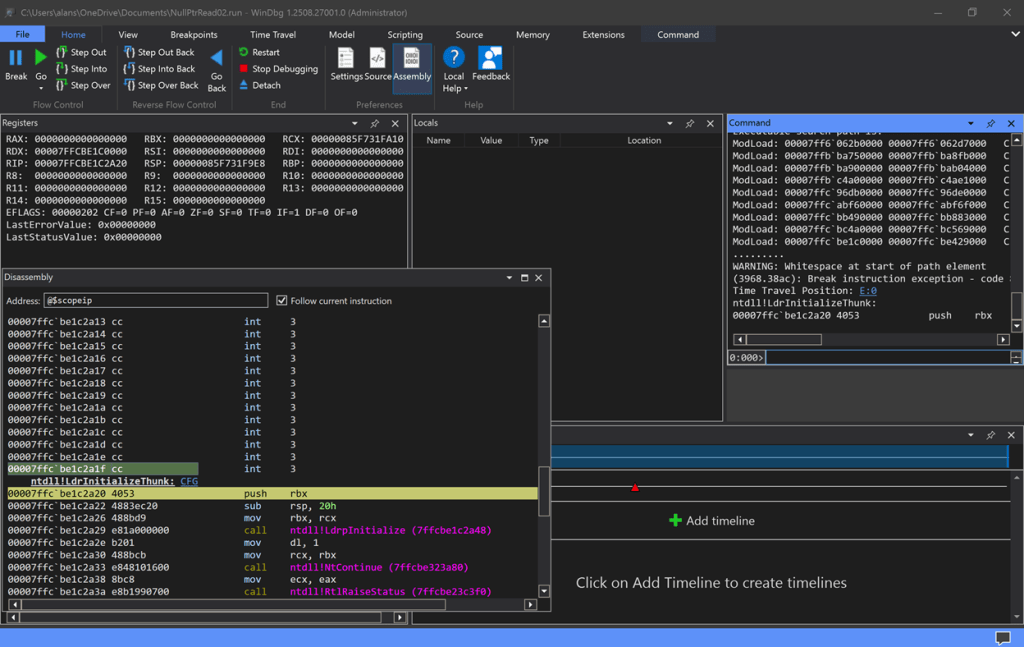
Now, you can debug this with any debugger, but only WinDbg supports TTD, so we’ll show how this works. To begin with the end in mind, below is a sample screenshot of WinDbg with TTD live in the NullPtrRead.exe application:
To get here, start by launching WinDbgX as Admin, and going to:
File > Launch Executable (advanced)
This is the entry that supports TTD.
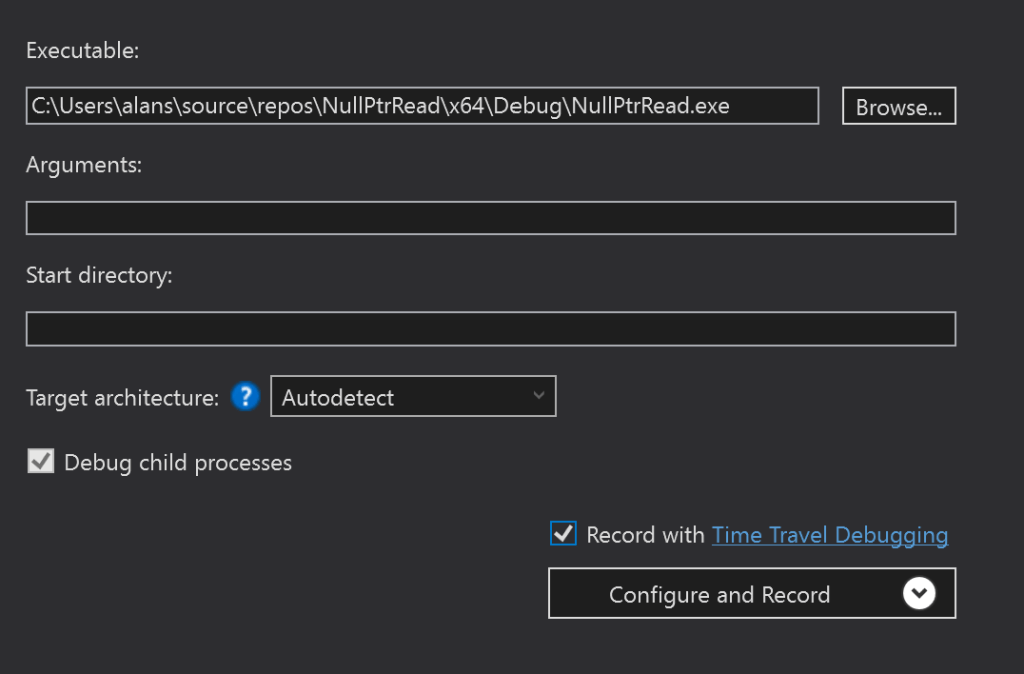
Find your .exe file, and click on the checkbox enabling TTD. Then hit Configure and Record. You’ll see something like the below. Yours will be different, but it helps to have at least the Command, Disassembly, Registers, and Local windows open:
The program will be launched, it crashes with the exception, and the trace file will be recorded and written to disk. And then the application will be re-launched to ntdll!LdrInitializeThunk so you can explore it. Cool!
The Command console window will look something like this:
************* Preparing the environment for Debugger Extensions Gallery repositories **************
ExtensionRepository : Implicit
UseExperimentalFeatureForNugetShare : true
AllowNugetExeUpdate : true
NonInteractiveNuget : true
AllowNugetMSCredentialProviderInstall : true
AllowParallelInitializationOfLocalRepositories : true
EnableRedirectToChakraJsProvider : false
-- Configuring repositories
----> Repository : LocalInstalled, Enabled: true
----> Repository : UserExtensions, Enabled: true
>>>>>>>>>>>>> Preparing the environment for Debugger Extensions Gallery repositories completed, duration 0.000 seconds
************* Waiting for Debugger Extensions Gallery to Initialize **************
>>>>>>>>>>>>> Waiting for Debugger Extensions Gallery to Initialize completed, duration 0.063 seconds
----> Repository : UserExtensions, Enabled: true, Packages count: 0
----> Repository : LocalInstalled, Enabled: true, Packages count: 45
Microsoft (R) Windows Debugger Version 10.0.27920.1001 AMD64
Copyright (c) Microsoft Corporation. All rights reserved.
Loading Dump File [C:\Users\alans\OneDrive\Documents\NullPtrRead02.run]
JavaScript script successfully loaded from 'C:\Program Files\WindowsApps\Microsoft.WinDbg_1.2508.27001.0_x64__8wekyb3d8bbwe\amd64\TTD\Analyzers\HeapAnalysis.js'
JavaScript script successfully loaded from 'C:\Program Files\WindowsApps\Microsoft.WinDbg_1.2508.27001.0_x64__8wekyb3d8bbwe\amd64\TTD\Analyzers\TtdAnalyze.js'
************* Path validation summary **************
Response Time (ms) Location
Deferred srv*
Symbol search path is: srv*
Executable search path is:
ModLoad: 00007ff6`062b0000 00007ff6`062d7000 C:\Users\alans\source\repos\NullPtrRead\x64\Debug\NullPtrRead.exe
ModLoad: 00007ffb`ba750000 00007ffb`ba8fb000 C:\Users\alans\AppData\Local\Microsoft\WindowsApps\Microsoft.WinDbg_8wekyb3d8bbwe\amd64\TTD\TTDRecordCPU.dll
ModLoad: 00007ffb`ba900000 00007ffb`bab04000 C:\WINDOWS\SYSTEM32\ucrtbased.dll
ModLoad: 00007ffb`c4a00000 00007ffb`c4ae1000 C:\WINDOWS\SYSTEM32\MSVCP140D.dll
ModLoad: 00007ffc`96db0000 00007ffc`96de0000 C:\WINDOWS\SYSTEM32\VCRUNTIME140D.dll
ModLoad: 00007ffc`abf60000 00007ffc`abf6f000 C:\WINDOWS\SYSTEM32\VCRUNTIME140_1D.dll
ModLoad: 00007ffc`bb490000 00007ffc`bb883000 C:\WINDOWS\System32\KERNELBASE.dll
ModLoad: 00007ffc`bc4a0000 00007ffc`bc569000 C:\WINDOWS\System32\KERNEL32.DLL
ModLoad: 00007ffc`be1c0000 00007ffc`be429000 C:\WINDOWS\SYSTEM32\ntdll.dll
.........
(3968.38ac): Break instruction exception - code 80000003 (first/second chance not available)
Time Travel Position: E:0 [Unindexed] Index
!index
Indexed 2/2 keyframes
Successfully created the index in 254ms.
************* Preparing the environment for Debugger Extensions Gallery repositories **************
ExtensionRepository : Implicit
UseExperimentalFeatureForNugetShare : true
AllowNugetExeUpdate : true
NonInteractiveNuget : true
AllowNugetMSCredentialProviderInstall : true
AllowParallelInitializationOfLocalRepositories : true
EnableRedirectToChakraJsProvider : false
-- Configuring repositories
----> Repository : LocalInstalled, Enabled: true
----> Repository : UserExtensions, Enabled: true
>>>>>>>>>>>>> Preparing the environment for Debugger Extensions Gallery repositories completed, duration 0.000 seconds
************* Waiting for Debugger Extensions Gallery to Initialize **************
>>>>>>>>>>>>> Waiting for Debugger Extensions Gallery to Initialize completed, duration 0.031 seconds
----> Repository : UserExtensions, Enabled: true, Packages count: 0
----> Repository : LocalInstalled, Enabled: true, Packages count: 45
Microsoft (R) Windows Debugger Version 10.0.27920.1001 AMD64
Copyright (c) Microsoft Corporation. All rights reserved.
Loading Dump File [C:\Users\alans\OneDrive\Documents\NullPtrRead02.run]
JavaScript script successfully loaded from 'C:\Program Files\WindowsApps\Microsoft.WinDbg_1.2508.27001.0_x64__8wekyb3d8bbwe\amd64\TTD\Analyzers\HeapAnalysis.js'
JavaScript script successfully loaded from 'C:\Program Files\WindowsApps\Microsoft.WinDbg_1.2508.27001.0_x64__8wekyb3d8bbwe\amd64\TTD\Analyzers\TtdAnalyze.js'
WARNING: Whitespace at start of path element
************* Path validation summary **************
Response Time (ms) Location
Deferred srv*C:\\symbols*http://msdl.microsoft.com/download/symbols
OK C:\Users\alans\source\repos\NullPtrRead\x64\Debug
WARNING: Whitespace at start of path element
Symbol search path is: srv*C:\\symbols*http://msdl.microsoft.com/download/symbols; ;C:\Users\alans\source\repos\NullPtrRead\x64\Debug
Executable search path is:
ModLoad: 00007ff6`062b0000 00007ff6`062d7000 C:\Users\alans\source\repos\NullPtrRead\x64\Debug\NullPtrRead.exe
ModLoad: 00007ffb`ba750000 00007ffb`ba8fb000 C:\Users\alans\AppData\Local\Microsoft\WindowsApps\Microsoft.WinDbg_8wekyb3d8bbwe\amd64\TTD\TTDRecordCPU.dll
ModLoad: 00007ffb`ba900000 00007ffb`bab04000 C:\WINDOWS\SYSTEM32\ucrtbased.dll
ModLoad: 00007ffb`c4a00000 00007ffb`c4ae1000 C:\WINDOWS\SYSTEM32\MSVCP140D.dll
ModLoad: 00007ffc`96db0000 00007ffc`96de0000 C:\WINDOWS\SYSTEM32\VCRUNTIME140D.dll
ModLoad: 00007ffc`abf60000 00007ffc`abf6f000 C:\WINDOWS\SYSTEM32\VCRUNTIME140_1D.dll
ModLoad: 00007ffc`bb490000 00007ffc`bb883000 C:\WINDOWS\System32\KERNELBASE.dll
ModLoad: 00007ffc`bc4a0000 00007ffc`bc569000 C:\WINDOWS\System32\KERNEL32.DLL
ModLoad: 00007ffc`be1c0000 00007ffc`be429000 C:\WINDOWS\SYSTEM32\ntdll.dll
.........
WARNING: Whitespace at start of path element
(3968.38ac): Break instruction exception - code 80000003 (first/second chance not available)
Time Travel Position: E:0
ntdll!LdrInitializeThunk:
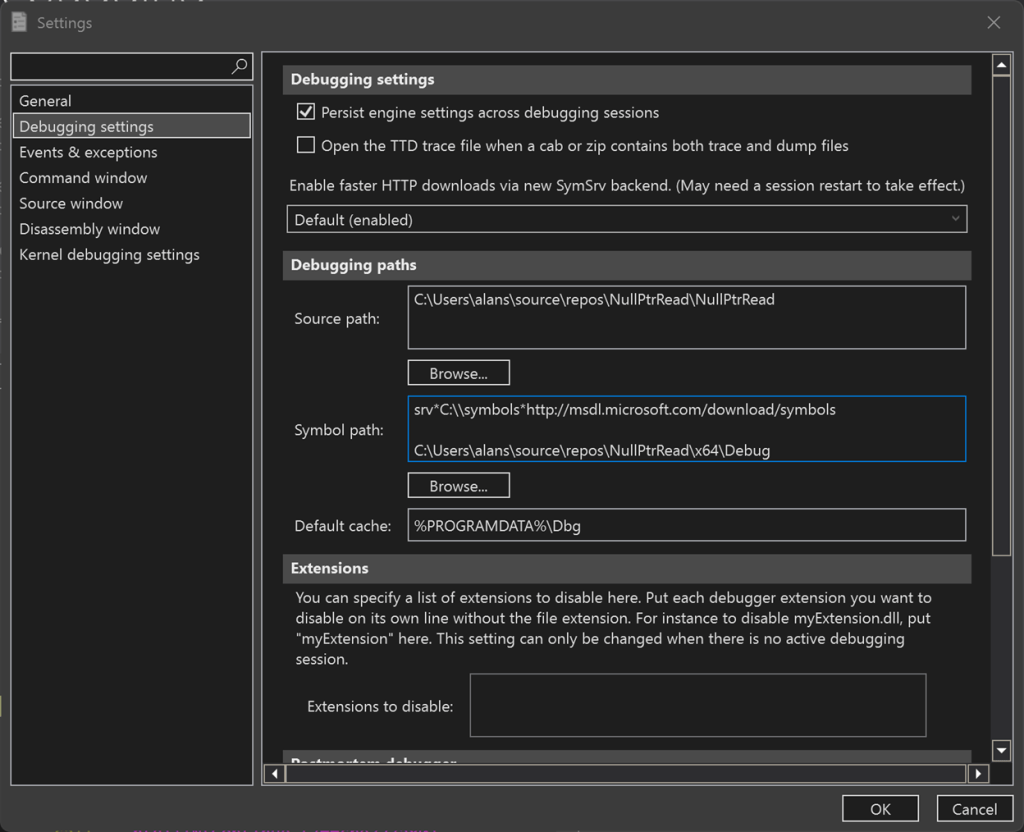
00007ffc`be1c2a20 4053 push rbxA word for people new to WinDbg: if you look carefully in the above output, you’ll see that I’d already set the symbol path to point to the PDB file generated by the Visual Studio Build:
Symbol search path is: srv*C:\\symbols*http://msdl.microsoft.com/download/symbols; ;C:\Users\alans\source\repos\NullPtrRead\x64\Debug
You’ll want to do the same, either by using the sympath command, as in:
.sympath+ C:\Users\alans\source\repos\NullPtrRead\x64\Debug
Or by adding it explicitly into:
File > Settings > Debug Settings
Since we have source and symbols, it helps to visualize everything by opening the source file as well, with:
File > Open source file
Given that we have source and symbols, we can operate on it just as in a regular debugging session, but this time on steroids! Let’s set a breakpoint at the application’s entry point:
>bp NullPtrRead!main
And the breakpoint shows as being set in the WinDbg source code window:
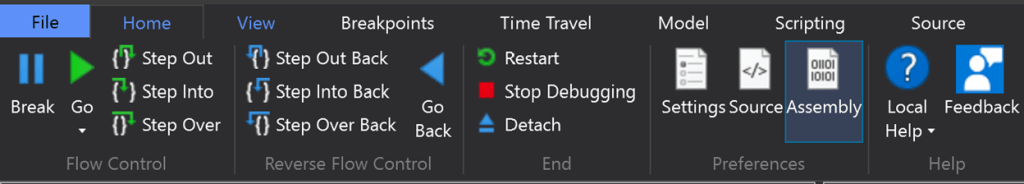
And you’ll see that now the Ribbon displays additional buttons for stepping not only forwards, but backwards in time, with Step Into Back, Step Over Back, Step Out Back, and even a Go Back button, in the Reverse Flow Control section:
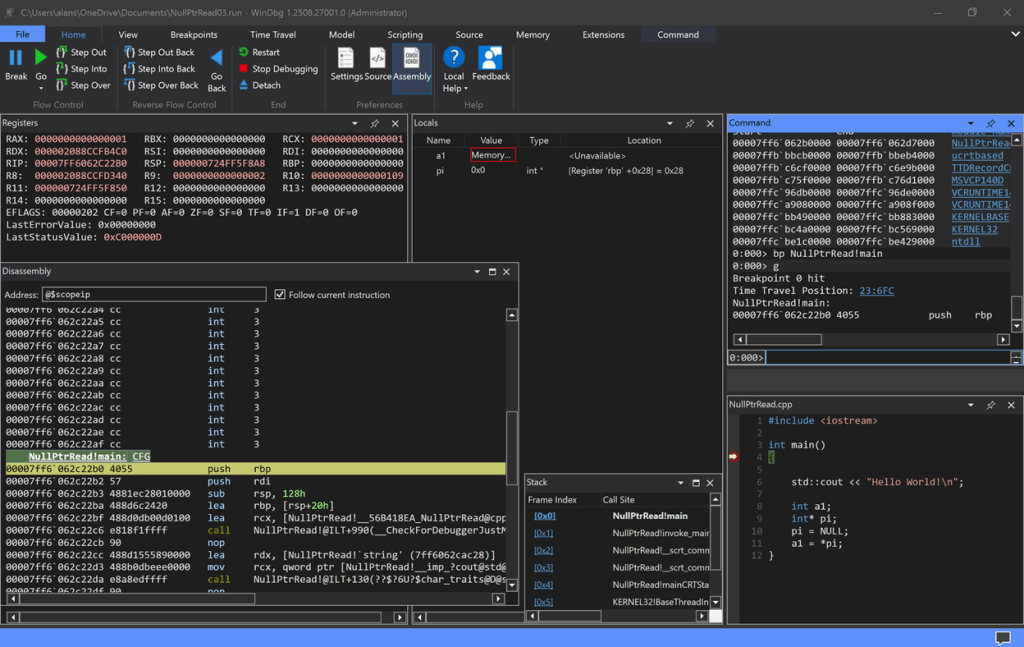
From now on, it’s smooth sailing. Hit Go and we hit the breakpoint at the entry point NullPtrRead!main:
Do a Step Out and you jump to the instruction that created the access violation. You can see this in the Source window and the Disassembly window for additional insight:
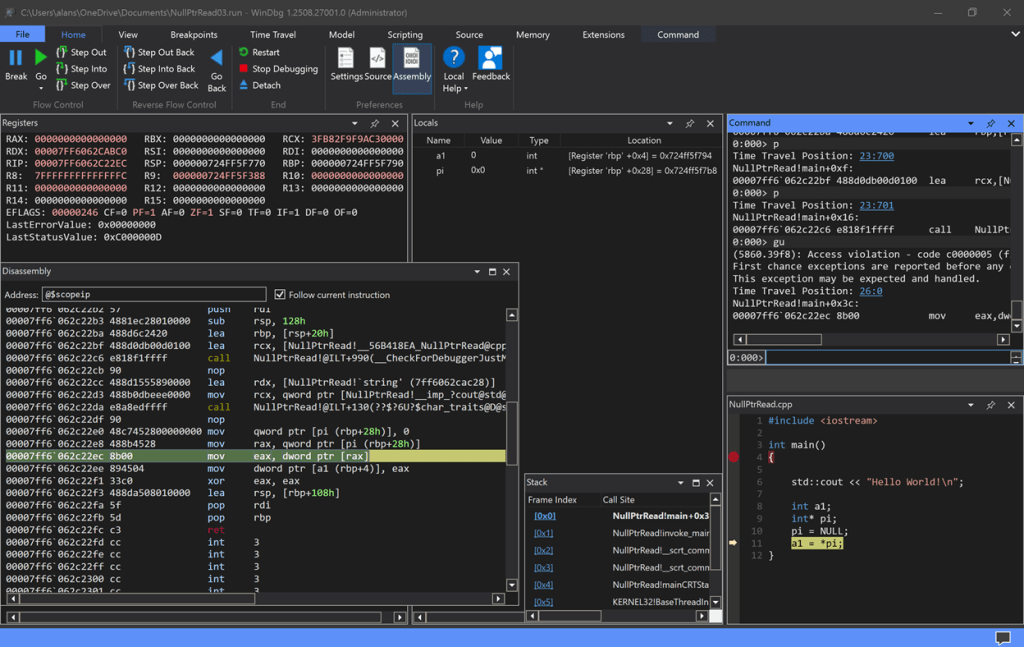
Note the last three instructions at the instruction pointer in the Disassembly window:
00007ff6`062c22e0 48c7452800000000 mov     qword ptr [pi (rbp+28h)], 0

00007ff6`062c22e8 488b4528         mov     rax, qword ptr [pi (rbp+28h)]

00007ff6`062c22ec 8b00             mov     eax, dword ptr [rax]
and the value of the locals and the RAX register. Do some Step Into Back’s, and Step Into’s to see how pi and a1 get changed, and RAX gets set to the bad value creating the access violation from the null pointer dereference.
Cool, huh? There are a ton more capabilities of TTD that you can find in the Microsoft tutorial content.
Check out this video to see the whole TTD session live:
To wrap up, here’s a table summarizing a stare-and-compare between TTD versus Intel PT:
| Feature | WinDbg Time Travel Debugging (TTD) | Intel Processor Trace (Intel PT) |
| Technology | Software-based emulator | Hardware-based CPU feature |
| Performance Overhead | High (5x-20x slowdown) | Very Low (typically < 5% slowdown) |
| Trace File Size | Very large (many GBs) | Small to medium (decoded trace is large) |
| Data Captured | Complete instruction, memory, and register state | Control flow (branches taken/not taken) and limited events |
| Debugging Use Case | Debugging complex, non-reproducible bugs and memory corruption | Debugging performance issues and code coverage analysis |
| Portability | High; trace files are portable across machines | Low; relies on specific hardware (Intel CPUs) |
| Analysis | Rich querying with dx and LINQ | Requires post-processing to decode the trace stream |
| Interactive Debugging | Post-mortem only; cannot alter program state | Post-mortem only; cannot alter program state |
| Key Limitations | High overhead and large file sizes. User-mode only. | Incomplete data (no memory/register state). |
Given the pros and cons above, a combination of the two tools might yield the most insight for malware research and threat analysis.
What other features of WinDbg TTD are useful for cybersecurity research and engagements? I’ll explore these in a future article.