

Introduction to LLVM and LLVM IR
In the evolving landscape of offensive security research, traditional code execution techniques face increasing scrutiny from modern detection systems. As a result, both offensive and defensive researchers are being pushed toward execution models that don’t look like traditional malware. LLVM Intermediate Representation (IR) presents such an opportunity. It is a file format that serves well for offensive code execution while remaining relatively under explored in security analysis workflows.
LLVM is not just a compiler in the traditional sense, but a full modular framework that can be used to build compilers, optimizers, interpreters, and JIT engines. At its core, LLVM provides a well defined intermediate representation (LLVM IR) similar to MSIL in .NET, which acts as a universal language between the source language frontend and the machine specific backend.
When you compile a C or C++ program with Clang, or a Rust program with rustc, you’re often producing LLVM IR first before it gets linked by the LLVM backend into actual machine code. This design makes LLVM both language and platform agnostic, which is a property that makes the IR file format such a fascinating playground for security research.
LLVM JIT (Just-In-Time) execution holds good potential for code execution in red team tradecraft. The cross language and platform nature of LLVM IR, combined with its ability to be obfuscated and executed through multiple JIT engines, makes it an attractive option for evasive payloads. Understanding how to trace and analyze JIT execution, from IR loading through compilation, linking, and execution, is crucial for both LLVM enthusiasts and defensive research. The techniques outlined in this post provide a foundation for analyzing LLVM JIT execution at each stage and strategies to recover, debug, disassemble and perform IR analysis along with possible detection strategies.
The LLVM Compilation Pipeline
A traditional compilation pipeline takes source code, turns it into LLVM IR, optionally runs optimizations, and then produces an object file that the linker combines into an executable. With LLVM IR, we’re not tied to a single platform or CPU.
This is because LLVM is built in a very modular way. The frontend’s job is just to translate source code into LLVM IR, while separate backends know how to turn that IR into machine code for different targets. Since these pieces are independent, the same IR can be reused for many architectures such as x86, ARM, RISC-V, GPUs, and more without altering the original source code.
This separation is what makes things like cross compilation, JIT compilation, and support for new hardware much easier. If you’re curious to dive deeper, you can read more about LLVM’s overall architecture in the official LLVM documentation: https://llvm.org/
At a high level, LLVM compiles a source file to an executable using the following process:
- Source → LLVM IR: A frontend (like clang or rustc) parses source into LLVM IR (
.llor.bc):
   # Generate IR from source
clang -emit-llvm -S hello.c -o hello.ll- LLVM IR → Machine IR → Obj: IR is optimized and lowered into machine specific instructions and emitted as an object file (
.o):
   # Optimize and emit an object file from IR
   opt -O2 hello.ll -o hello.opt.bc
llc -filetype=obj hello.opt.bc -o hello.obj- Obj → Executable: The linker resolves symbols and generates the final binary:
   # Link the object file into a native executable
   clang hello.obj -o hello

   # Or on Windows with MSVC
   link hello.obj /OUT:hello.exe

LLVM Compilation Architecture
The cross platform capability makes IR a lightweight file format that serves well for staging execution. The IR file format is also not commonly seen in typical security analysis, making it an attractive option for lightweight evasive payloads. Stealthy interpretation can be achieved using multiple JIT execution engines (ORC, MCJIT, and custom interpreters), each offering different characteristics and detection profiles.
The advantages of OLLVM obfuscation support on IR extend to both static and dynamic detection evasion. Even more interestingly, IR produced from entirely different languages like C, Rust, and Nim and can all be fed into the same LLVM JIT engine and executed seamlessly, provided they use the same LLVM version. This realization raises an intriguing question, what if LLVM IR itself became a vehicle for cross platform code execution? With JIT runtimes, you could generate code once, obfuscate it, and then run it anywhere. That’s the core idea behind the IRvana project.
Overview of JIT Engines
Unlike a traditional static linker that produces a fixed COFF/PE binary ahead of time, LLVM’s JIT engines compile and link code inside the running process itself. With static linking, all symbols, relocations, and code layout decisions are finalized before execution and then handled by the OS loader. JIT engines like MCJIT and ORC replace that entire model with an in process compiler and linker, generating executable machine code on demand and mapping it directly into memory. This allows code to be compiled lazily, modified or replaced at runtime, and optimized using real execution context, rather than assumptions made at build time. The result is a far more flexible execution model where code is transient, dynamic, and tightly coupled to runtime behavior, in contrast to the fixed and observable structure of a statically linked COFF binary.
MCJIT: The Legacy Engine
MCJIT (Machine Code Just-In-Time Execution Engine) is the older and simpler of the two JIT engines. It works by eagerly compiling entire modules into machine code once they’re added to the engine. After calling finalizeObject(), you get back native code pointers that can be invoked directly.
The downside is that MCJIT doesn’t provide much modularity. You can’t easily unload or recompile just one function without recompiling the whole module. Internally, MCJIT uses a RuntimeDyld wrapper for dynamic linking and memory management, specifically through an RTDyldMemoryManager. The EngineBuilder initiates the creation of an MCJIT instance, which then interacts with these components to manage the compilation and execution pipeline.

For detailed information on MCJIT’s design and implementation, see: https://llvm.org/docs/MCJITDesignAndImplementation.html
ORC: The Modern JIT Architecture
ORC (On-Request Compilation), by contrast, is the modern JIT architecture in LLVM. ORC is designed around layers that give you fine-grain control over the execution pipeline. For example, an IRTransformLayer lets you inject custom passes, whether optimizations or obfuscations, more efficiently before code is lowered. A CompileLayer takes IR and turns it into object code, which is then handled by the ObjectLayer that manages memory mappings. All of this is orchestrated through an ExecutionSession.
Unlike MCJIT, ORC supports true lazy compilation. Functions are only compiled when they’re called for the first time. This makes it more efficient and, for our purposes, more interesting to trace and analyze. The JITDylib class, a fundamental component in ORC, is thread safe and reference counted, inheriting from ThreadSafeRefCountedBase<JITDylib> and utilizing jitlink::JITLinkDylib for managing and linking JIT compiled code segments.
For detailed information on ORC, see: https://llvm.org/docs/ORCv2.html
Custom Interpreters
Beyond MCJIT and ORC, custom interpreters can be built using LLVM’s APIs to provide specialized execution environments. These custom interpreters offer the flexibility to implement domain specific optimizations, security controls, or analysis hooks that aren’t available in the standard engines.
Custom interpreters typically leverage LLVM’s ExecutionEngine API or build upon ORC’s layered architecture to create tailored execution environments. They can intercept IR operations, modify execution flow, add custom optimization passes, or implement specialized memory management strategies. This makes them particularly valuable for security research, where fine grain control over execution is essential. Here are two good examples of custom IR interpreters.
- LLVMDynamicTools (https://github.com/grievejia/LLVMDynamicTools) provides a framework for building dynamic analysis tools on top of LLVM. It enables researchers to create custom interpreters that can instrument IR execution, track memory operations, and perform runtime analysis.
- llvm-ei (https://github.com/sampsyo/llvm-ei) implements an explicit interpreter for LLVM IR, executing instructions directly without JIT compilation. This approach provides maximum control over execution flow, enabling step by step interpretation of IR instructions.
Building a custom interpreter typically involves:
- Module Loading: Parsing IR files or bitcode into LLVM
Moduleobjects - Execution Engine Setup: Configuring either an
ExecutionEngine(for MCJIT) or anExecutionSessionwith custom layers (for ORC) - Custom Passes: Injecting optimization or analysis passes into the compilation pipeline
- Symbol Resolution: Implementing custom symbol resolution logic for external functions
- Memory Management: Defining how executable memory is allocated and managed
For offensive security research, custom interpreters can be designed to support encrypted IR loading, implement anti-analysis techniques, or provide specialized execution environments that evade detection more effectively than standard LLVM tools.
IRvana: A Framework for Cross Language IR Generation, Obfuscation, and JIT Execution
IRvana is an experimental framework designed to standardize IR generation, obfuscation, and JIT execution across multiple programming languages. This project standardizes IR generation on a single LLVM version (18.1.5) across all frontends, ensuring the IR produced is linked and stable for execution through lli, ORCJIT, MCJIT, or custom interpreters.
By aligning compiler flags, links, and toolchains, IRvana helps build a consistent IR pipeline to generate IR from C, C++, Rust, and Nim project sources with multiple source files.
LLVM optimizations are designed to simplify control flow, remove redundancy, and make program behavior more predictable and efficient, whereas OLLVM works by intentionally subverting those same assumptions at the IR level transforming optimized, well structured IR into deoptimized complex forms that resist further optimization and static analysis.
IRvana integrates obfuscation at the IR level using OLLVM. Techniques such as control flow flattening, indirect calls, string encryption, and indirect branching are applied to harden the IR and simulate real world evasive payloads. These techniques are applied post linking or on a per file basis, depending on the obfuscation mode selected.
OLLVM Repository: https://github.com/0xlane/ollvm-rust
IRvana includes built in LLVM tools and multiple proof of concepts that demonstrate JIT (Just-In-Time) execution using ORCJIT and MCJIT, capable of interpreting generated IR. Malware development related integrations such as in memory IR loading and encrypted payload decryption have also been documented for real world applications. These examples bridge LLVM IR tooling with malware development practices to explore JIT code execution and BYOI (Bring Your Own Interpreter) techniques in depth.
IRvana Repository: https://github.com/m3rcer/IRvana
Tracing JIT Runtime Execution
Understanding how to trace and analyze JIT runtime execution is crucial for both LLVM developers and security researchers. The analysis of JIT execution involves several key components:
- Interpreter Component: JIT execution using MCJIT, ORC, or custom interpreters
- LLVM IR Analysis: Analyzing and reversing IR, as IR can embed stage 2 execution for loaders
- Decompiled IR Analysis: Reversing the embedded loader, which may further house shellcode
We will focus on analyzing the interpreter component internals (JIT execution), understanding how IR and compiled COFF/ELF objects can be recovered from memory during the JIT interpretation process, and gain a high level overview of LLVM IR analysis techniques that can be applied after recovering IR bytes from memory.
If symbols are available, it’s relatively straightforward to trace and step through LLVM APIs. However, in real world scenarios, we often need to rely on lower level analysis techniques.
As an example, here’s the source used to analyze JIT execution using lli (Default IR interpreter in LLVM toolset) for a simple hello world example.
#include <stdio.h>

int main()
{
    //__builtin_debugtrap();
    printf("hello, world\n");
    getchar();
}
Conversion from source to IR with IRvana:
JIT execution tested using lli (by default uses ORCJIT for LLVM 18): lli.exe final.ll
JIT Execution Using LLVM Interpreters
Stage 1: Loading IR into Memory
At this stage, LLVM reads the .ll or .bc file from disk or memory maps it so it can be parsed into a Module object. The source can be:
.llor.bc text parsed byllvm::parseIRFile()- A
MemoryBufferholding the IR/bitcode
APIs to Watch:
CreateFileWorCreateFileAReadFileCreateFileMappingWorCreateFileMappingAMapViewOfFileorMapViewOfFileExOpenFileMapping
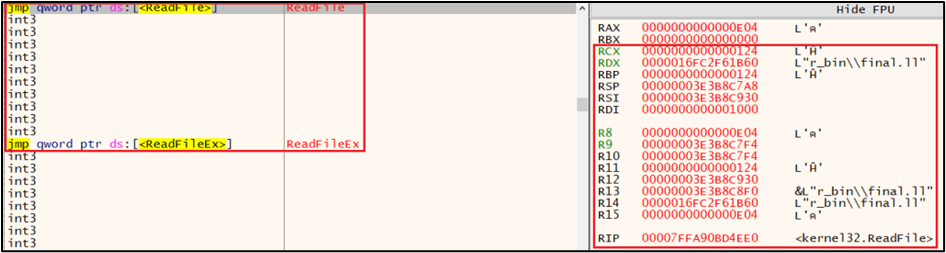
CreateFile API call with IR file path:
ReadFile API Call reading IR file:
Process Handles and Execution Context:
What to Inspect:
- CreateFile: Check
RCX(filename pointer) for.lland.bcextensions. - ReadFile:
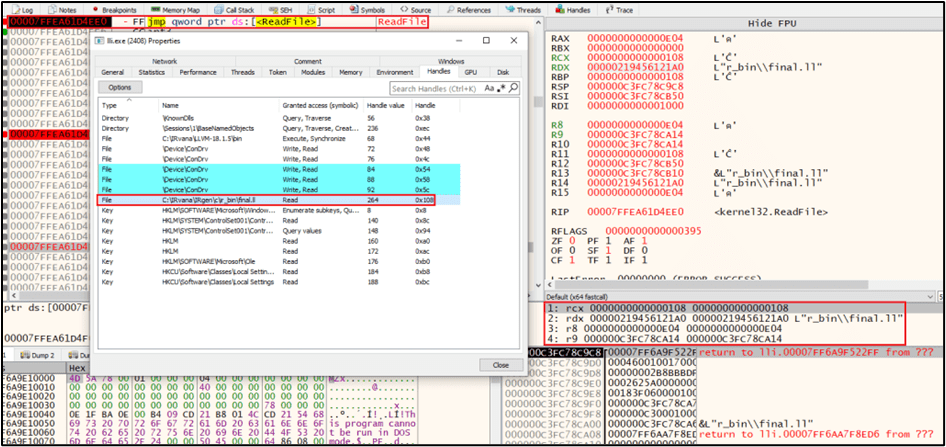
RCX= handle,RDX= buffer pointer,R8= bytes to read. After the call, it is possible to capture the IR buffer. It contains raw IR bytes read from disk which can be further analysed and dissassembled.
As an example, it’s possible to recover IR executed from memory after execution of the ReadFile WINAPI. Here’s an example analysing and recovering IR bytes from memory after ReadFile has been executed:
Further analysing this memory region reveals that it’s a Private ReadWrite region on the Heap:

Stage 2: IR Kept in Memory and Module Handed to ORC
LLVM converts the file into an in memory buffer (MemoryBuffer) that holds the raw IR text or bitcode before parsing. The top level ORC object inserts the Module into a JITDylib. A MaterializationUnit describes how to materialize (compile/link) the symbols. On symbol lookup, ORC triggers the materialization process.
APIs to Watch:
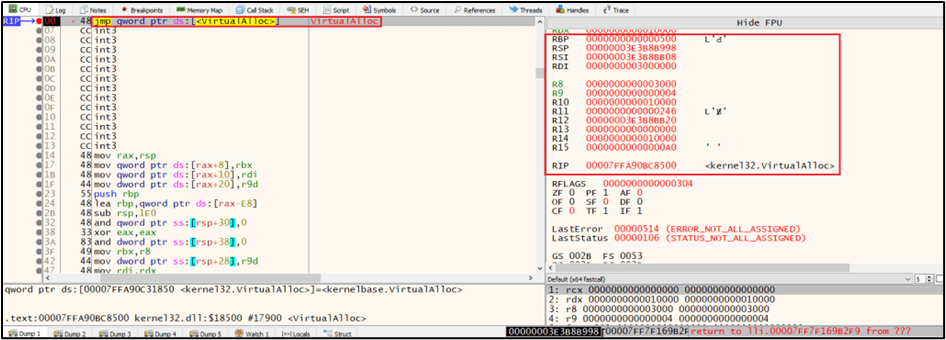
VirtualAllocHeapAlloc,HeapCreate, orRtlAllocateHeap
VirtualAlloc for IR Buffer Allocation:
What to Inspect:
- On
VirtualAlloc/HeapAllocwhere the returned pointer is used soon after by parse routines, dump that region and scan for ASCIIdefine,declare, or LL/BC magic bytes
Stage 3: IR to Object Compilation
The ORC compile layer converts the LLVM IR into a relocatable object (ELF/COFF) that can later be linked into executable memory. IRCompileLayer compiles LLVM IR into a relocatable object (in memory) using target backends. This produces bytes representing an object file (ELF/COFF/MachO sections). The IR still exists in memory up to this point if you didn’t free it.
APIs to Watch:
CreateFileMappingandMapViewOfFileVirtualAllocorHeapAlloc
In Memory Object File Buffer:
What to Inspect:
- Look for anonymous
VirtualAllocor heap allocations of sizes consistent with object files. Dump buffers from returned addresses. They may contain ELF, COFF, or Mach-O headers or.osection bytes.
Disassembly of Compiled Object File:

If you have retrieved a COFF/ELF object, you can further analyse it as follows:
llvm-objdump reference: https://llvm.org/docs/CommandGuide/llvm-objdump.html
# If you have a COFF/ELF object saved
llvm-objdump -d dumped.o

# If you dumped raw binary bytes use objdump with binary format
objdump -D -b binary -m i386:x86-64 dumped.bin > dumped.s
Stage 4: Object Parsing and JIT Linking
The ObjectLinkingLayer takes the in memory object and:
- Parses sections and relocations
- Allocates target executable or data memory for sections
- Applies relocations and resolves symbols (runtime relocation resolution)
- Installs stubs or trampolines for lazy compilation if needed
APIs to Watch:
VirtualAllocorVirtualProtectFlushInstructionCacheRtlAddFunctionTable,RtlInstallFunctionTableCallback,RtlAddGrowableFunctionTable
VirtualProtect Memory Protection Change:
What to Inspect:
- Break on VirtualAlloc or NtAllocateVirtualMemory: Check
RCX(lpAddress),RDX(size),R8(allocation type),R9(protection). If protection includesPAGE_READWRITEorPAGE_EXECUTE_READWRITEand size matches an object section, note the returned address (RAX) and dump that region after writes complete. - RtlAddFunctionTable and similar: Indicate registration of unwind information. Parameters include
TableBase,EntryCount, andBaseAddress, which are useful metadata to map addresses to functions.
JIT Code Pages with RW/RX Permissions:
Stage 5: Runtime Relocation Resolution & Trampolines
RuntimeDyld or JITLink resolves relocations (fixes addresses, emits stubs) and registers frames or unwinds information if needed. After relocation, the code is ready to be called.
APIs to Watch:
- VirtualAlloc or VirtualProtect API calls
ReadProcessMemoryorWriteProcessMemorysometimes used by tools creating trampolines in other processes- Presence of small executable regions with
jmpormovsequences
Trampoline Code for Runtime Relocation:
What to Inspect:
Dump small newly executable pages and search for patterns:
jmpinstructions to resolved function addressesmovinstructions loading addresses into registers- Trampoline sequences that bridge calls between modules
Stage 6: Symbol Lookup and Execution
The ORC caller requests an address for a symbol (ex: main). ORC returns the JIT address and execution jumps there. The ORC itself calls into memory to get an address. At the OS level, you’ll just see execution transfer into a JIT page. However, you can detect the first call into the region by tracing threads or setting memory breakpoints.
JIT Compiled Code Execution Entry Point:
What to Inspect:
- Once you know the unbacked region base, set an execution breakpoint on the region start to catch first entry and capture call stack or context. Then dump surrounding code and disassemble.
Executable Memory Page:
Call Stack with JIT Code Address:

IR Debugging and Reversing
Once IR bytes have been recovered from memory during the JIT execution process, it is possible to further analyze the IR by debugging it, disassembling it, or compiling it into an executable and reversing it to understand its functionality. We can explore several techniques as mentioned below.
Debugging with LLDB
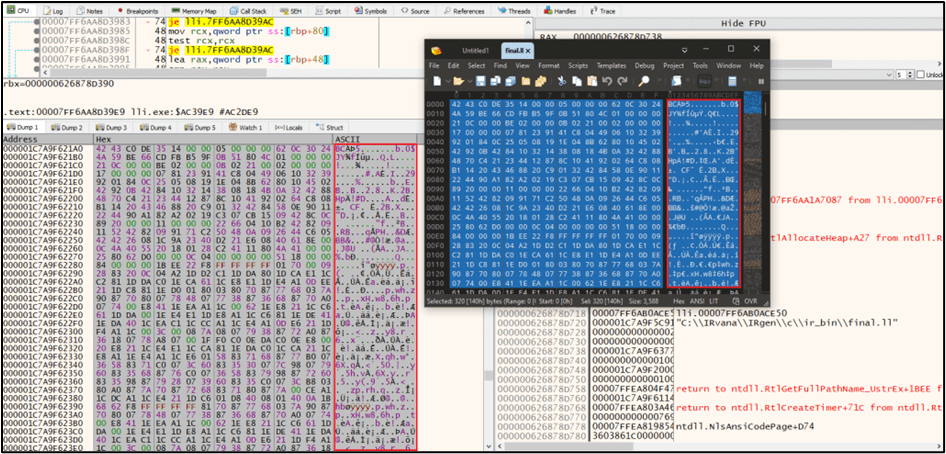
You can use functions like __builtin_debugtrap(); to insert breakpoints in your IR code.
When debugging with LLDB, you can step through JIT compiled code and inspect memory. For example, examining the %rcx register after loading a string address:
The debugger reveals the string "hello, world\n" stored at the address in the register, demonstrating how JIT compiled code manages data.
Using debugir for IR Level Debugging
It’s possible to use projects like debugir (https://github.com/vaivaswatha/debugir) to add debugging information to LLVM IR files. Although there isn’t any Windows based compilation support by default, it’s possible to compile it with Visual Studio 2022 with a few changes: https://github.com/vaivaswatha/debugir/pull/27
Running debugir over an IR file produces a .dbg.ll file. The new file is semantically the same as the input file, but with debug information referring to the input file. This allows a debugger such as GDB or LLDB (LLVM debugger) to pick up and display more information as execution proceeds.
Decompiling IR to C Pseudocode
It’s possible to use tools such as:
- Rellic: https://github.com/lifting-bits/rellic
- NotDec-llvm2c: https://github.com/NotDec/NotDec-llvm2c
These tools can disassemble IR to C pseudocode, making analysis more accessible.
Here’s an example using Rellic (although it supports native LLVM 16, it can still be used with LLVM 18 generated IR):
Rellic IR to C Decompilation:
## IR to C decompilation command using rellic
rellic-decomp --input final.ll --output final.c
Decompiled C Code Output:
The decompiled C code shows the main function along with how variadic functions like printf are handled in the IR, including the use of LLVM specific functions like llvm_va_start and llvm_va_end for argument handling.
Compiling to Native Executable for Traditional Reverse Engineering
It’s also possible to compile IR into a native executable using LLVM’s llc and then disassemble and reverse using tools such as IDA or Ghidra:
llc final.ll -filetype=obj -o final.obj
link final.obj /OUT:final.exe
Example using IDA:

IDA can disassemble the compiled executable, showing the assembly instructions and allowing for detailed analysis of the compiled code.
IDA Website: https://hex-rays.com/
Example using Ghidra:
Ghidra provides both assembly level and decompiled C like views, making it easier to understand the program’s logic. The decompiled view clearly shows the main function calling printf("hello, world\n") and getchar(), matching the original source code structure.
Ghidra Repository: https://github.com/NationalSecurityAgency/ghidra
Detection Strategies
Based on the analysis techniques described above, several detection strategies can be implemented to identify LLVM JIT execution in a system:
- File I/O and API Call Patterns: Monitor for processes that read
.llor.bcfiles, especially when followed by memory allocation patterns consistent with JIT compilation. Detect suspicious API call sequences such asCreateFilefollowed byReadFile,VirtualAllocwithPAGE_READWRITEfollowed byVirtualProtecttoPAGE_EXECUTE_READ, orFlushInstructionCacheafter memory writes. At these points it is often possible to dump raw IR or compiled object files, as shown in the earlier stages. - Memory Allocation and Protection Changes: Look for processes that allocate unbacked memory with
PAGE_READWRITEfollowed byPAGE_EXECUTE_READprotection changes, create multiple small executable memory regions (characteristic of JIT code pages), or register function tables dynamically viaRtlAddFunctionTablecalls. Periodically scan executable memory regions for suspicious patterns and dump memory to analyze for JIT compiled code patterns, unusual code generation, or the presence of trampolines and stubs. - Static Analysis and Process Identification: Scan files and in memory buffers for LLVM IR magic bytes or object file headers (COFF/ELF/Mach-O). Identify processes that load LLVM libraries or LLVM related DLLs, and look for IR related strings in binaries such as
"define","declare","@main", or LLVM version strings. - Execution Flow and Behavioral Analysis: Monitor for execution jumping into recently allocated memory regions, calls to dynamically resolved symbols, or suspicious call stacks where frames in known interpreters lead into unbacked executable memory that contains JIT compiled code.
- Network Monitoring: If IR or object files are fetched remotely, detect downloads of
.ll,.bc, or unusual binary blobs that may carry IR or JIT compiled payloads.
Conclusion and Credits
LLVM’s JIT execution model exposes a dynamic and often overlooked layer of modern program execution where code is transient and interpreted in memory at runtime. By walking through the full lifecycle of LLVM IR execution from loading IR, through JIT compilation, linking, and runtime execution, it is possible to understand how this model fundamentally changes how code can be staged, transformed, and observed.
For security researchers, this model shifts the focus towards runtime behaviour such as memory allocation patterns, protection changes, and execution flow. These traits make LLVM JIT execution hard to trace with traditional tooling.
As LLVM continues to underpin large parts of today’s software ecosystem, understanding how its JIT engines can behave for offensive code execution at runtime is essential. The techniques covered here are meant to serve as a practical starting point for exploring, tracing, and detecting offensive IR based execution.
Special thanks to the following contributors and resources:
- Cipher007 for streamlining installation for IRvana and an insightful blog post “code-in-the-Middle: An Introduction to IR” – https://rohannk.com/posts/Code-in-the-Middle/
- OLLVM Rust – https://github.com/0xlane/ollvm-rust
- LLVM Obfuscation Experiments by TrustedSec – https://github.com/trustedsec/LLVM-Obfuscation-Experiments
- LLVM Project – https://llvm.org/ and https://github.com/llvm/llvm-project
- LLVM IR Introduction by mcyoung – https://mcyoung.xyz/2023/08/01/llvm-ir/